




Dashboards
Visualize your search results and metrics, using Dashboards.
Cribl Search offers customizable Dashboards with a variety of visualizations, in the form of panels, that you can tailor to fit your needs. Visualization panels are discrete units of displayed data that you can organize, interact with, and modify. A panel can be backed by a log search or, when Metrics (Preview) is enabled, by a metrics query.
You might add visualizations to a Dashboard to track server performance over time and on an event timeline. Or, you might add visualizations to display customer behavior with donut charts and top-hitters lists.
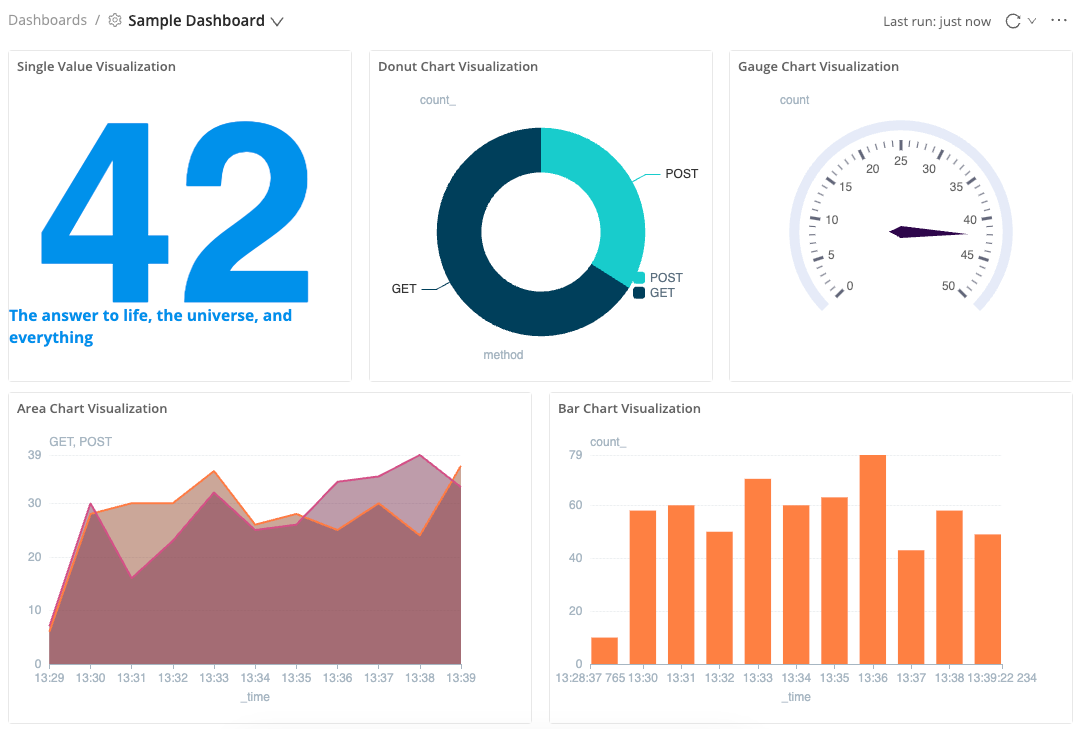
To start working with Dashboards, select Dashboards from the Cribl Search sidebar. To import Grafana Dashboards, select Migrate.
For details about who can access and modify this resource, see Search Member Permissions. With appropriate Permissions, you can export, share, and import Dashboards in Packs.
To zoom any Dashboard visualization panel up to a larger view, select the Actions button at the panel’s top right, then select Full Screen.
Cribl Search includes two Dashboards that you can use right away:
- Search Monitoring displays search status and CPU seconds over time, as well as details about completed searches and searches by user.
- Sample Dashboard provides examples of the types of data displays you can create with visualization panels.
These two Dashboards are standard for all users and cannot be edited. However, you can clone the Sample Dashboard and revise it for your own needs.
To quickly access your most recent Dashboards from any Cribl Suite product, select Products in the top bar, then hover over Dashboards.