




Explore LLM Telemetry in Cribl Search
Use Cribl Search to explore, investigate, and visualize LLM telemetry.
When LLM telemetry lands in Cribl Search, you can:
- Run ad hoc investigations (errors, latency, usage spikes).
- Correlate LLM spans with infrastructure or security telemetry.
- Build dashboards and scheduled searches for usage, cost, and performance.
Prerequisites
- LLM telemetry in Cribl Search from your instrumented application.
- Datasets configured in Cribl Search for LLM data.
Search LLM Telemetry
Store your LLM telemetry in a Dataset, then query it directly in Cribl Search with KQL for fast investigation and analysis.
- Create a Dataset and use Dataset rules to route your LLM telemetry into it. Search Datasets are hosted in lakehouse engines and are optimized for fast, schema-aware search and AI workflows.
- Use that Dataset in queries to filter by service, model, or environment; slice by token usage or cost; and narrow on error or status fields for failing requests.
Investigate Incidents and Performance Regressions
During an incident (for example, elevated LLM error rates or latency):
- Start from an LLM telemetry Dataset in Search.
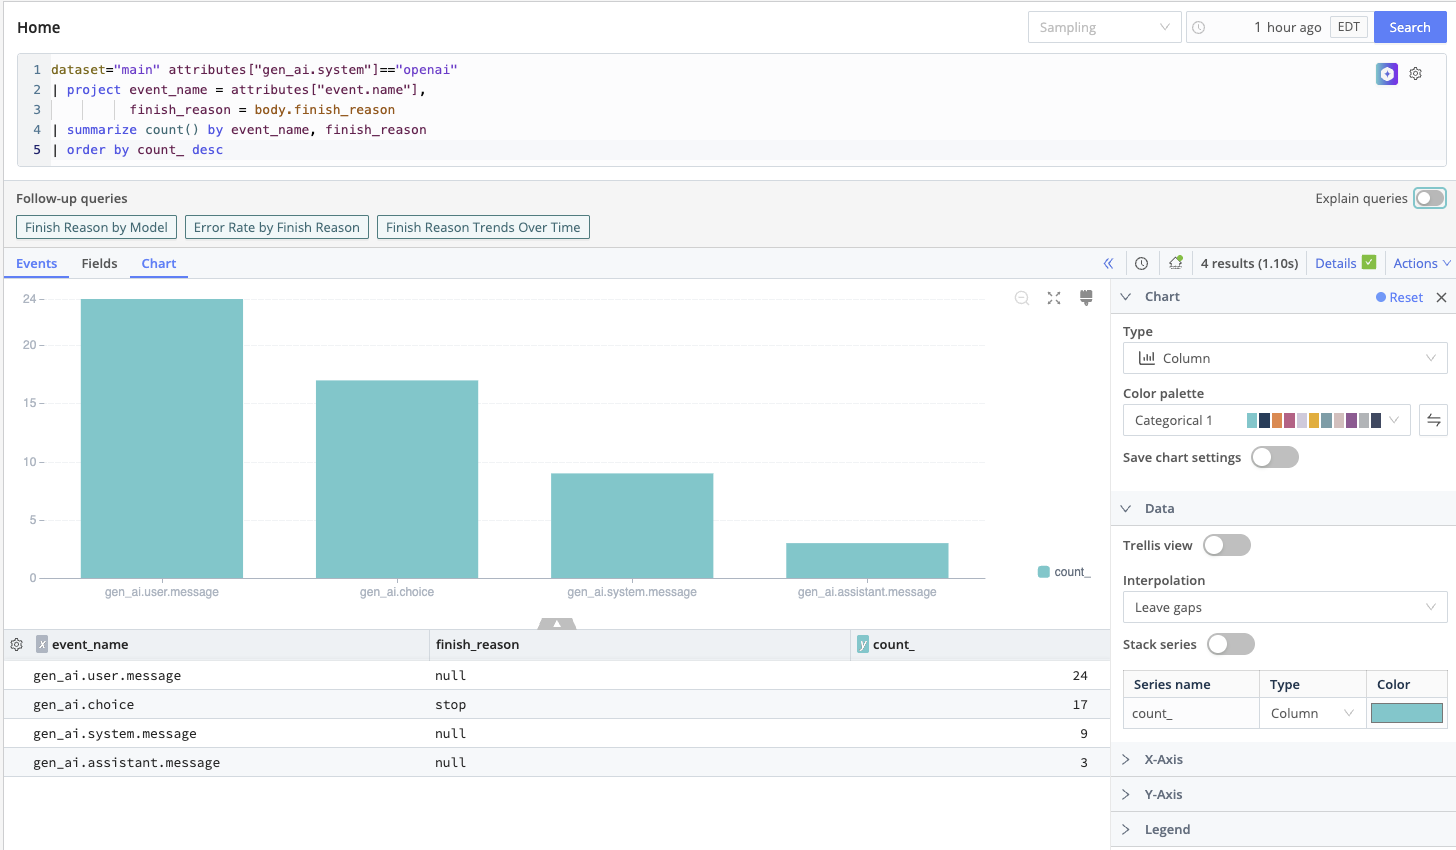
- Use filters and aggregation operators (such as
summarizeortimestats) to break down failures by model or deployment, prompt type or application feature, and tenant, user, or region. - Correlate with other Datasets (for example, infrastructure or API gateway logs) using
joinor related operators to see upstream and downstream symptoms together.
Build Dashboards for LLM Usage and Cost
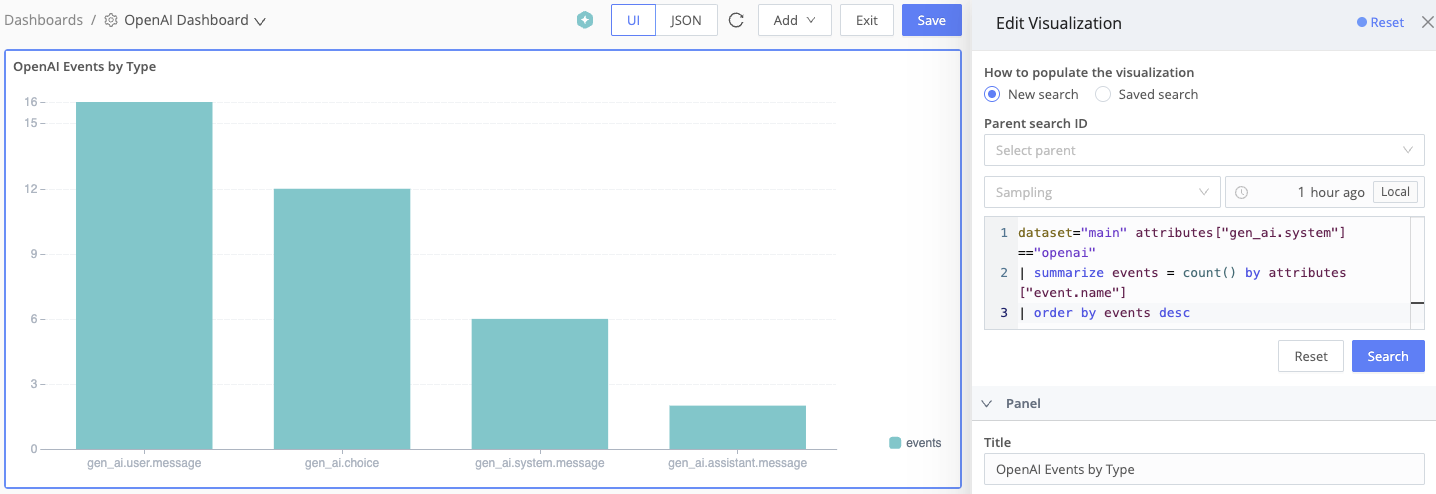
Use Cribl Search Dashboards to visualize:
- Requests over time by model or application.
- Token usage and derived cost over time.
- Error rates by environment or tenant.
Add charts for P95/P99 latency, token count distributions, and traffic share per model or feature path.
Automate Checks with Scheduled Searches and Notifications
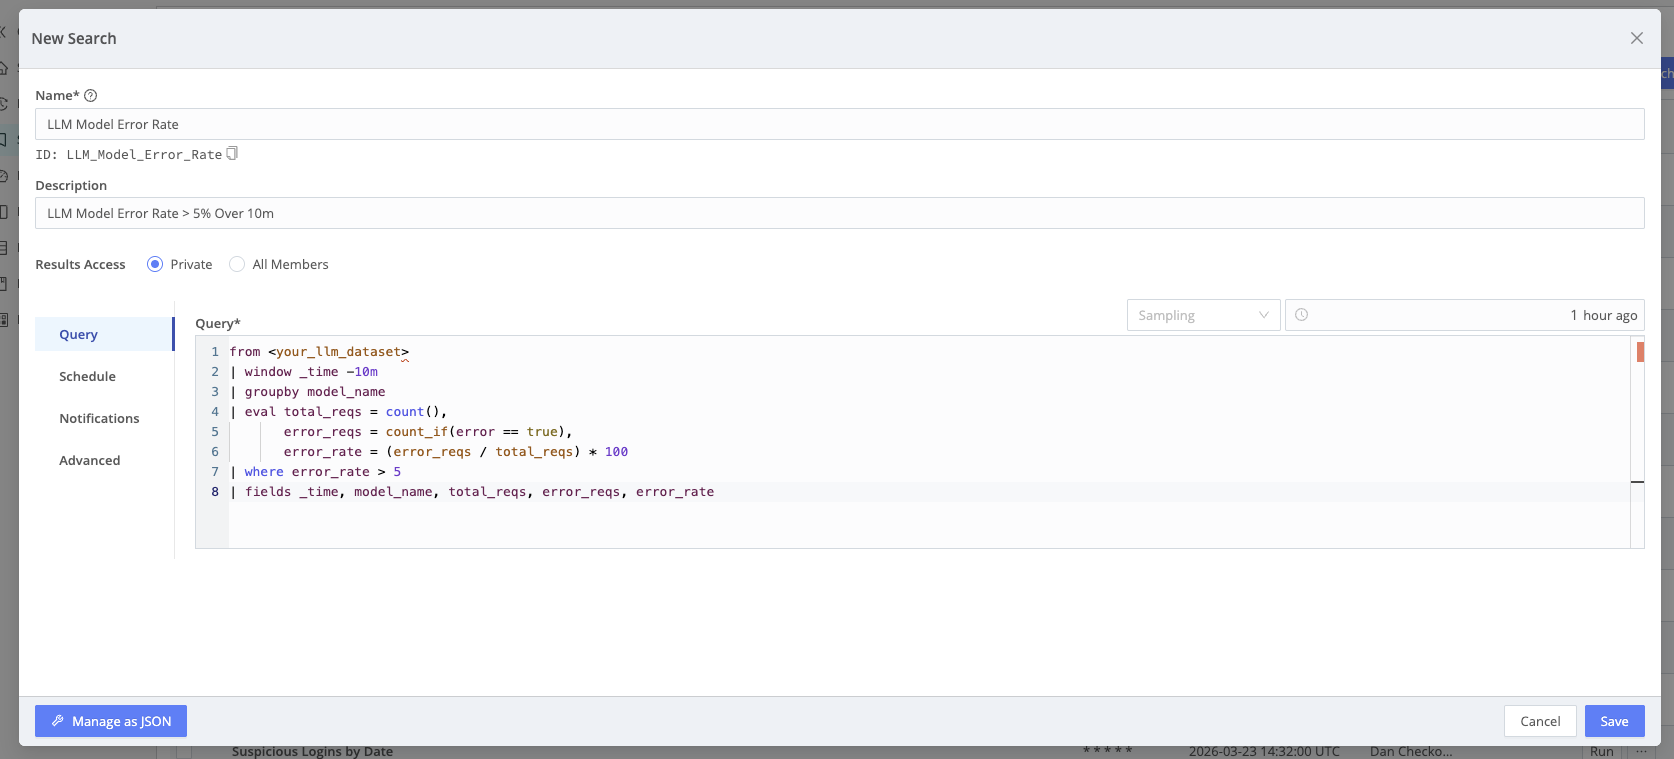
Turn critical queries into Scheduled Searches–for example, alert when estimated LLM cost exceeds a threshold over the last hour, or when error rate for a model exceeds a limit over 10 minutes. Attach Notifications for email, Slack, SNS, or other targets.