


Streamline Logs Storage and Analysis with a Lakehouse
Use a Cribl Lakehouse to efficiently store, and quickly analyze, high-volume recent telemetry data.
Deprecation Notice
For lakehouse workloads, we now recommend using Cribl Search lakehouse engines. Lakehouses in Cribl Lake will be deprecated in a future release.
You don’t have to take immediate action, though; your existing Lakehouses will continue to work. We’ll provide advance notice before you need to make any changes to your existing Lakehouses. Your Cribl Account Team can help with a plan to migrate from Lakehouse to a lakehouse engine.
This is an overview of how to ingest log files into a Lakehouse, and then use Cribl Search to periodically analyze only specific data relevant for threat-hunting or security investigations.
Especially as data volume increases, this can be a cost-effective alternative to bulk-forwarding data to a traditional SIEM system. This page demonstrates sequential setup in your upstream logs sender, Cribl Stream, Cribl Lake, and Cribl Search. The broad steps are:
- Collect and stage logs in the applications and frameworks that generate them..
- Shape the data, using a Cribl Stream Parser.
- Create a Cribl Lake Dataset to store your parsed data.
- Route the parsed data to the new Lake Dataset.
- Configure a Lakehouse, to support low-latency analytics in Cribl Search.
- Analyze relevant data, using Cribl Search ad hoc and scheduled queries.
- Visualize your data, using Cribl Search predefined or custom Dashboards.
Collect, Stage, and Shape Logs
Once you’ve configured log collection on the infrastructure where you run your applications, ingesting logs into Cribl Stream provides a straightforward way to parse events for efficient storage and retrieval in Cribl Lake.
Cribl Stream ships with dedicated Source integrations for common data senders and protocols. Our Integrations page outlines steps for customizing our Sources to ingest data from senders without dedicated counterparts.
Shape with Parsers
With data flowing through Cribl Stream, you can apply the built-in Parser Function to parse events into fields optimized for Cribl Lake storage. This Function enables you to choose from a library of predefined Parsers for common data sources, and the library’s UI facilitates customizing, cloning, and adding Parsers to shape your specific data.
Here, we provide specific steps for collecting, staging, and parsing three common Amazon log formats: VPC Flow Logs, CloudTrail logs, and CloudFront logs. Beyond these specific examples, you can use a similar workflow to efficiently store and analyze many other types of logs, by substituting a different Stream Parser or configuring your own.
Collect and Stage VPC Flow Logs
Your first steps take place in the Amazon VPC console or EC2 console. If you’re not already collecting VPC Flow Logs, the Amazon Logging IP Traffic Using VPC Flow Logs documentation provides specific instructions.
- Set up AWS VPC Flow logging within your AWS account.
- Configure writing the VPC Flow Logs to an Amazon S3 bucket.
- Enable S3 permissions for Cribl Stream to read from the bucket.
Shape (Parse) the Data
Next, use Cribl Stream to ingest your VPC Flow Logs data, and to parse the named fields that Lakehouse requires. (You’ll want to configure all Stream steps within your Cribl.Cloud Organization, to enable routing to Cribl Lake later.)
- Configure a Cribl Stream Amazon S3 Source to continuously collect (stream) data from your S3 bucket.
- Create or adapt a simple Cribl Stream Pipeline that will process this data.
- Add a single Parser Function to the Pipeline.
- In the Parser, accept default
Extractmode, then set the Library toAWS VPC Flow Logs. As shown below, this will automatically set the Type toExtended Log File Format. - Save the Pipeline.
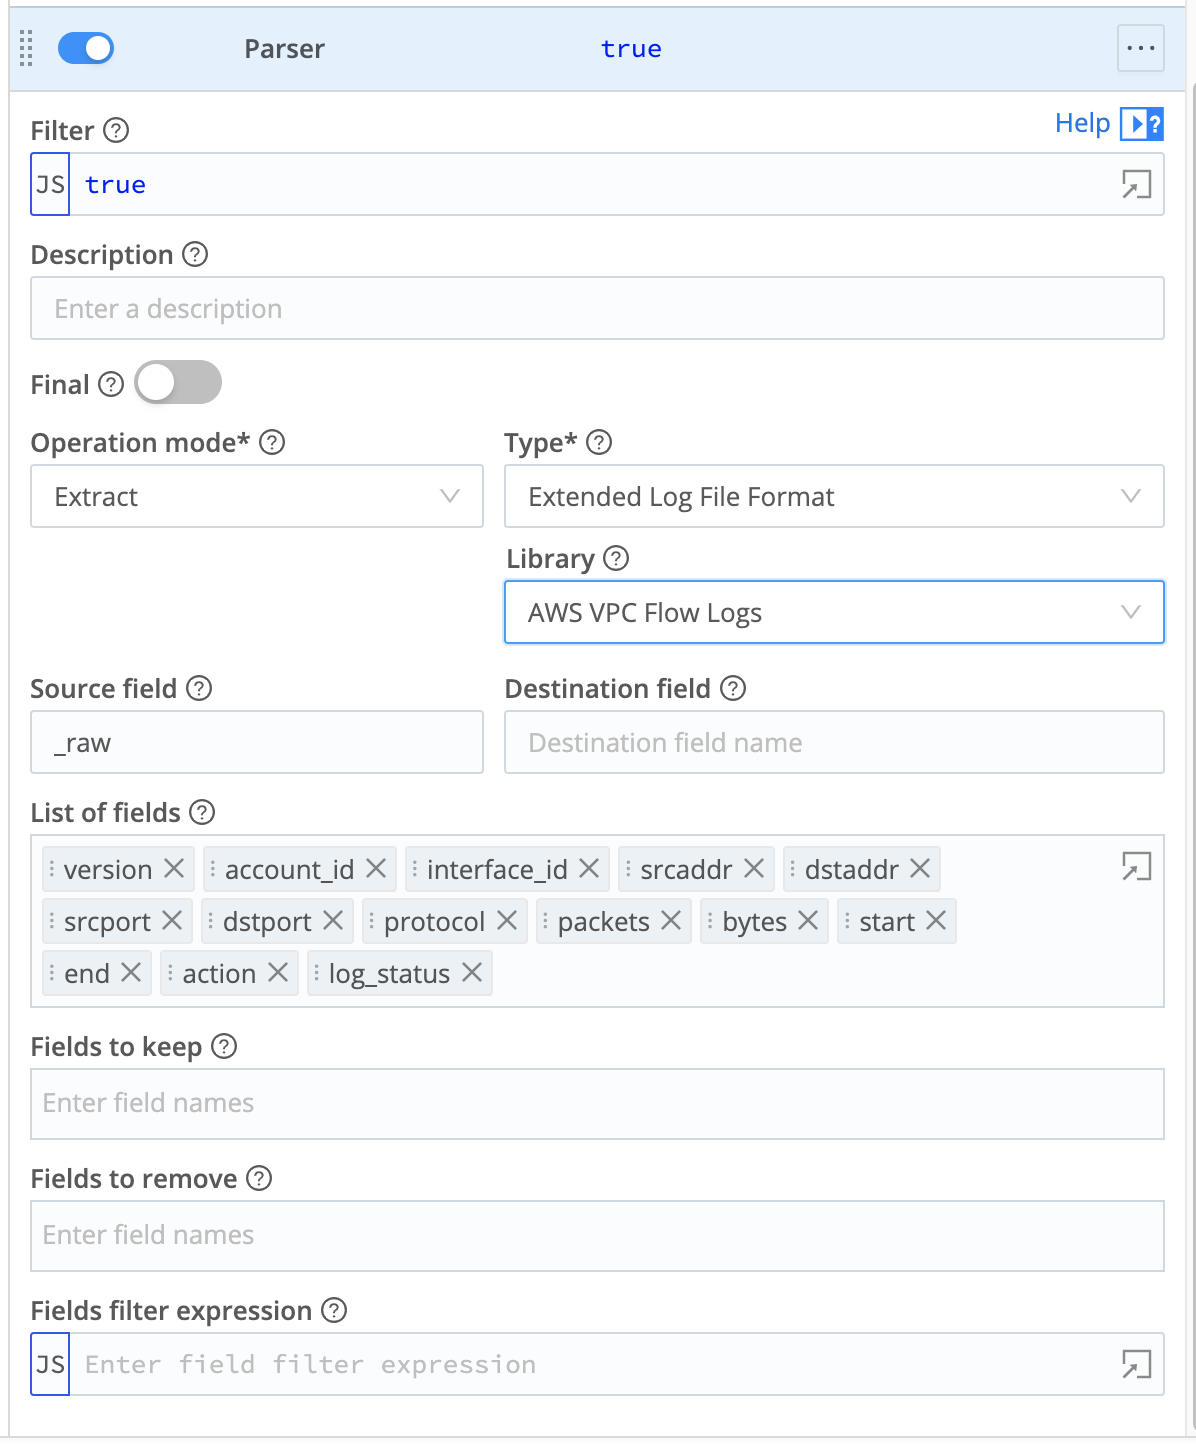
You might choose to expand this Pipeline to add Tags, or to add other predefined Cribl Stream Functions to shape or narrow your data in specific ways. This scenario presents the simplest scenario to parse your data for Cribl Lake.
The Cribl AWS VPC Flow for Security Teams Pack provides sample Pipelines that you can adapt and add to Cribl Stream. For usage details, see Cribl Stream for InfoSec: VPC Flow Logs - Reduce or Enrich? Why Not Both? You can also use the Cribl Copilot Editor (AI) feature to build a Pipeline from a natural-language description of the processing you want.
Collect and Stage CloudTrail Logs
Your first steps take place in the Amazon Management Console. If you’re not already collecting CloudTrail logs, the Amazon What Is AWS CloudTrail? documentation provides specific instructions.
- Set up trails within your AWS account to log events of interest.
- Configure writing the CloudTrail logs to an Amazon S3 bucket.
- Enable S3 permissions for Cribl Stream to read from the bucket.
Shape the Data
Next, use Cribl Stream to ingest your CloudTrail data, and to parse the named fields that Lakehouse requires. (You’ll want to configure all Stream steps within your Cribl.Cloud Organization, to enable routing to Cribl Lake later.)
- Configure a Cribl Stream Amazon S3 Source to continuously collect (stream) data from your S3 bucket.
- Create or adapt a simple Cribl Stream Pipeline that will process this data.
- Add a single Parser Function to the Pipeline.
- In the Parser, accept default
Extractmode, then set the Library toAWS VPC Flow Logs(this library can handle CloudTrail logs, too). As shown below, this will automatically set the Type toExtended Log File Format. - Save the Pipeline.
You might choose to expand this Pipeline to add Tags, or to add other predefined Cribl Stream Functions to shape or narrow your data in specific ways. This scenario presents the simplest scenario to parse your data for Cribl Lake.
The Cribl Pack for AWS CloudTrail Data Collection provides sample Pipelines that you can adapt and add to Cribl Stream. You can also use the Cribl Copilot Editor (AI) feature to build a Pipeline from a natural-language description of the processing you want.
Collect and Stage CloudFront Logs
If you’re not already collecting CloudFront logs, the Amazon CloudFront and Edge Function Logging documentation provides specific instructions.
- In your Amazon account, set up CloudFront logging options of interest.
- Configure writing the CloudFront logs to an Amazon S3 bucket.
- Enable S3 permissions for Cribl Stream to read from the bucket.
Shape (Parse) the Data
Next, use Cribl Stream to ingest your CloudFront data, and to parse the named fields that Lakehouse requires. (You’ll want to configure all Stream steps within your Cribl.Cloud Organization, to enable routing to Cribl Lake later.)
- Configure a Cribl Stream Amazon S3 Source to continuously collect (stream) data from your S3 bucket.
- Create or adapt a simple Cribl Stream Pipeline that will process this data.
- Add a single Parser Function to the Pipeline.
- In the Parser, accept default
Extractmode, then set the Library toAWS CloudFront. As shown below, this will automatically set the Type toDelimited values. - Save the Pipeline.
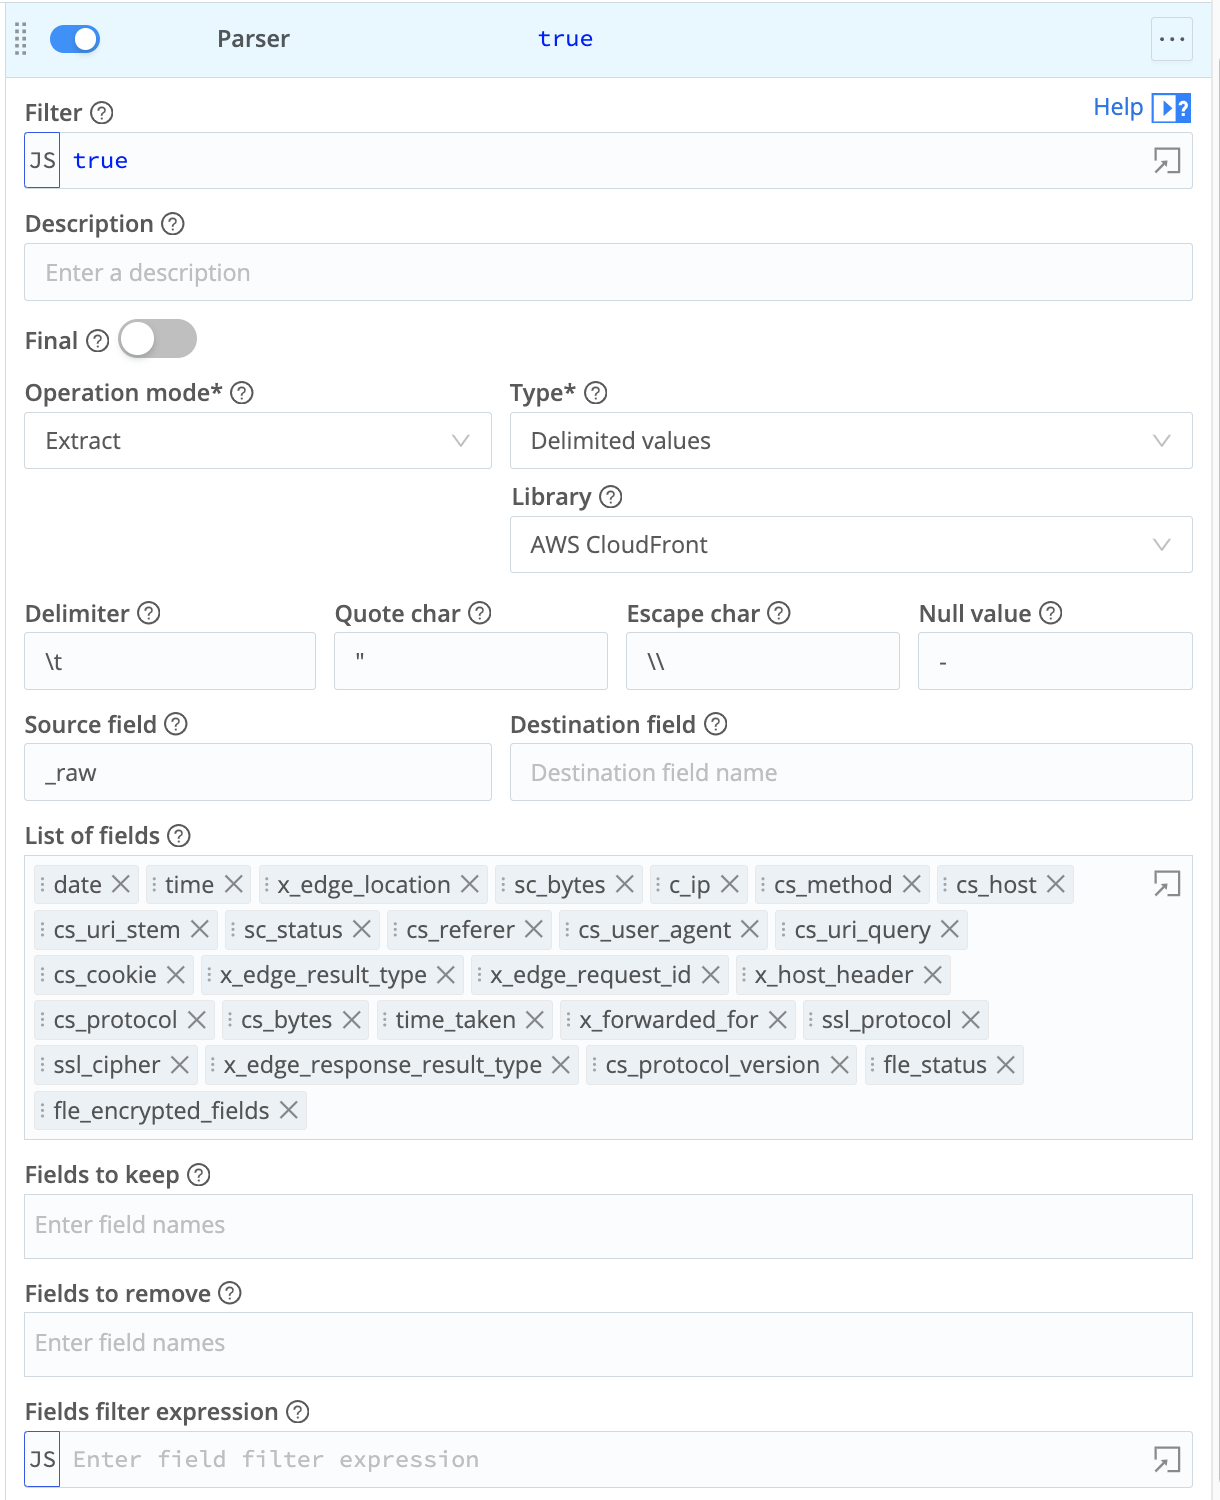
You might choose to expand this Pipeline to add Tags, or to add other predefined Cribl Stream Functions to shape or narrow your data in specific ways. This scenario presents the simplest scenario to parse your data for Cribl Lake.
You can also use the Cribl Copilot Editor (AI) feature to build a Pipeline from a natural-language description of the processing you want.
Create a Cribl Lake Dataset
In Cribl Lake, create a Lake Dataset to store your shaped data.
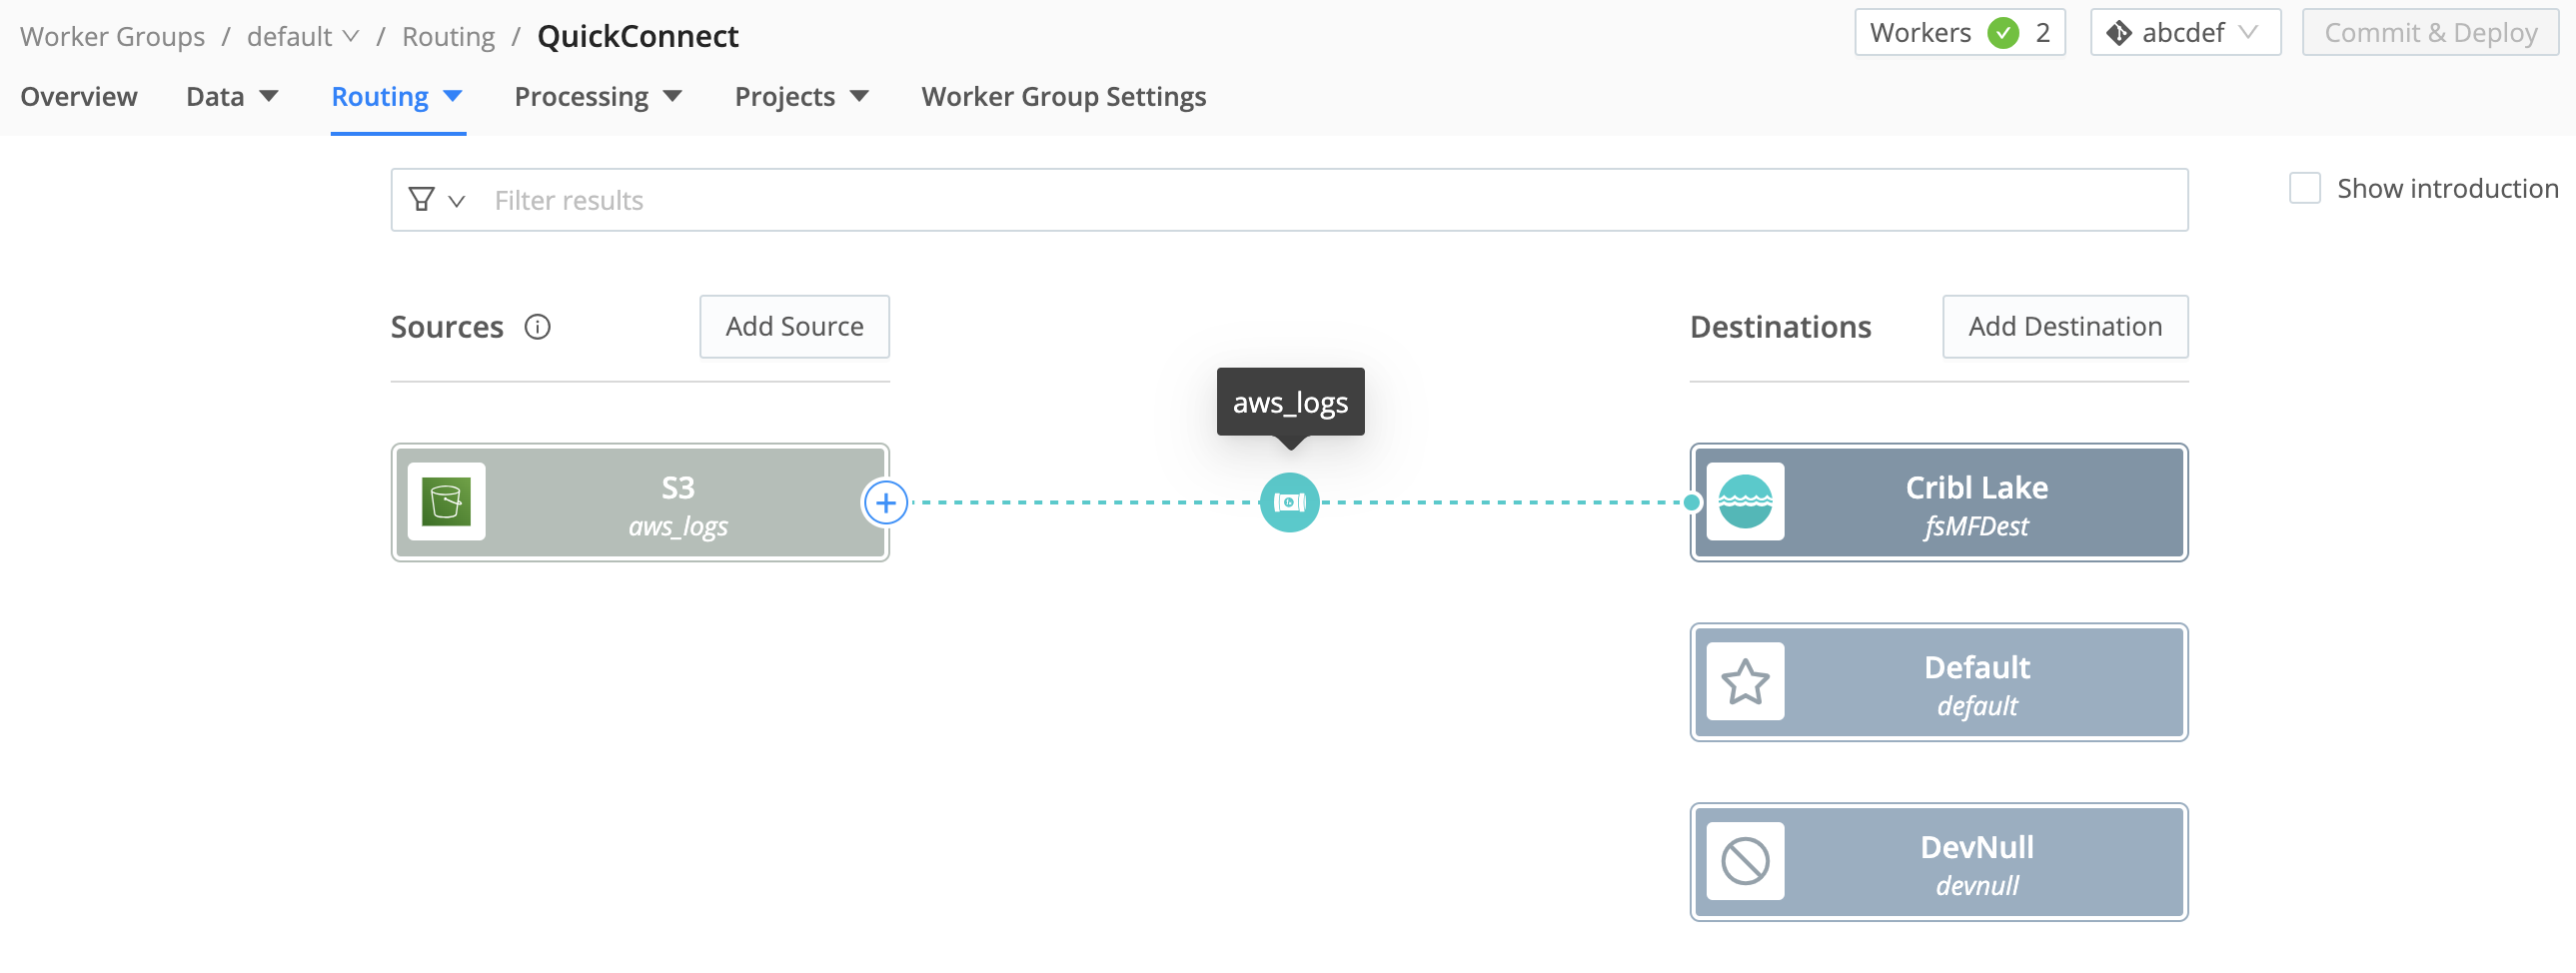
Route the Parsed Data to Cribl Lake
Back in Cribl Stream, route your shaped data to your Lake Dataset.
- Add a Cribl Lake Destination.
- Within that Destination, select the Lake Dataset you’ve just created, and save the Destination.
- You can use either QuickConnect or Data Routes to connect your S3 Source to your Lake Destination through the Pipeline you configured earlier. (The Destination page linked above covers both options.)
Configure a Lakehouse For Low-Latency Analytics
With data flow now established from your infrastructure all the way to Cribl Lake, assign the Lake Dataset to a Lakehouse to enable fast analytics.
Add a Lakehouse, sized to match your expected daily ingest volume.
When the Lakehouse is provisioned, assign your Lake Dataset to the Lakehouse.
Analyze Relevant Data
In Cribl Search, define queries to extract relevant data from your logs. Here is a sample query to retrieve and present rejected connections by source address:
dataset="<your_lakehouse_dataset>"
| action="REJECT"
| summarize by srcaddrYou can schedule your searches to run on defined intervals. Once a query is scheduled, you can configure corresponding alerts (Search Notifications) to trigger on custom conditions that you define.
Here is a sample query you could schedule to generate an hourly report that tracks traffic by source and destination:
dataset ="<your_lakehouse_dataset>" srcaddr="*" dstaddr="*"
| summarize count() by srcaddr, dstaddr
| sort by count descIf you’re moving high-volume log analysis from a traditional SIEM to Cribl, you might need to adapt existing queries to the KQL language that Cribl Search uses. See our Build a Search overview and our Common Query Examples.
You can also Write Queries Using Cribl Copilot, enabling Cribl AI to suggest KQL queries from your natural-language prompts. If you already have searches in another system of analysis, try asking Copilot to translate them to KQL.
The
cribl_search_sampleDataset, built into Cribl Search, contains VPC Flow Logs events. You can use this Dataset to experiment with queries before you enable continuous data flow and analysis.
Visualize Your Analyzed Data
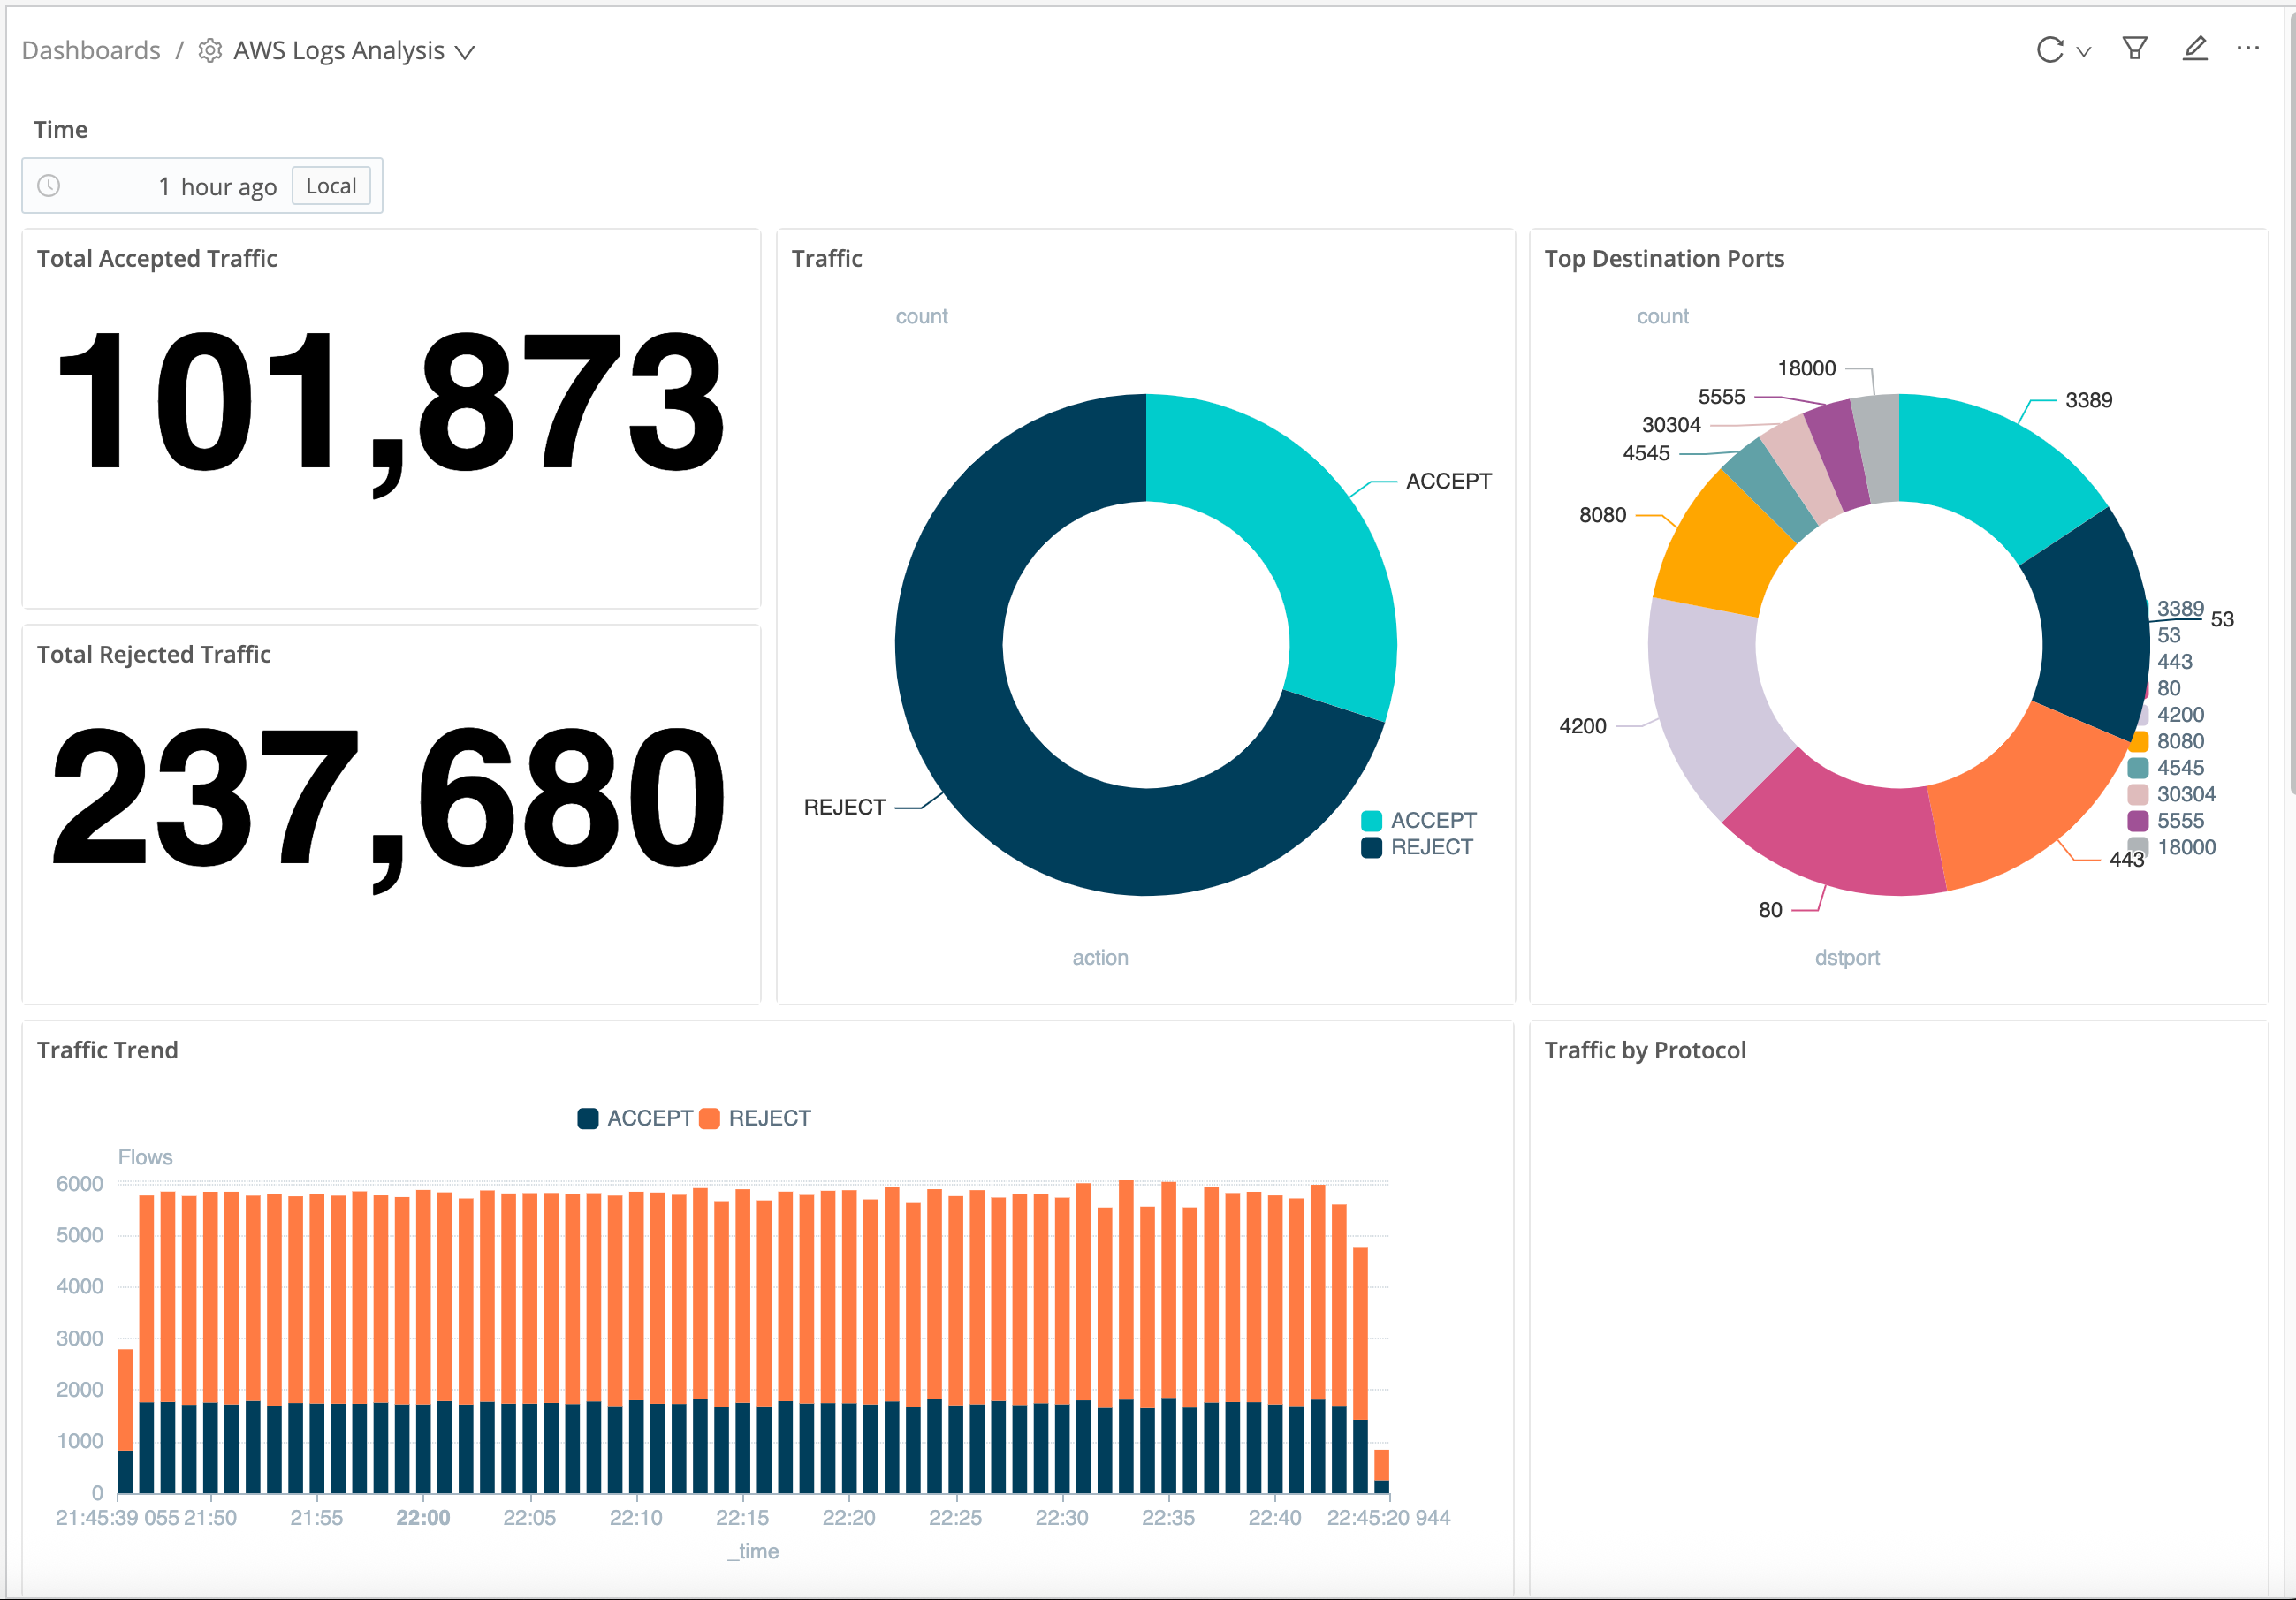
In Cribl Search, you can build flexible Dashboards to visualize your analytics.
As a starting point for displaying analytics on many log types, you can import the Cribl Search AWS VPC Flow Logs Pack. It contains a sample AWS VPC Flow Logs Analysis Dashboard that displays traffic volume, traffic accepted and rejected (both time-series and cumulative), traffic by protocol, and top destination ports.
Cribl AI can automatically suggest visualizations for your Dataset, and can build visualizations from your natural-language prompts. For these options, see Add Visualizations Using Cribl Copilot.
Next Steps
To refine your queries and visualizations, see the Cribl Search docs: