


Validate Pipeline Logic Using Data Preview
You can use the Data Preview tool to preview, test, and validate the Functions you add to a Pipeline or Route. It helps ensure that your Pipeline and Function configurations produce the expected output, giving you confidence that Cribl Edge processes your data as intended.
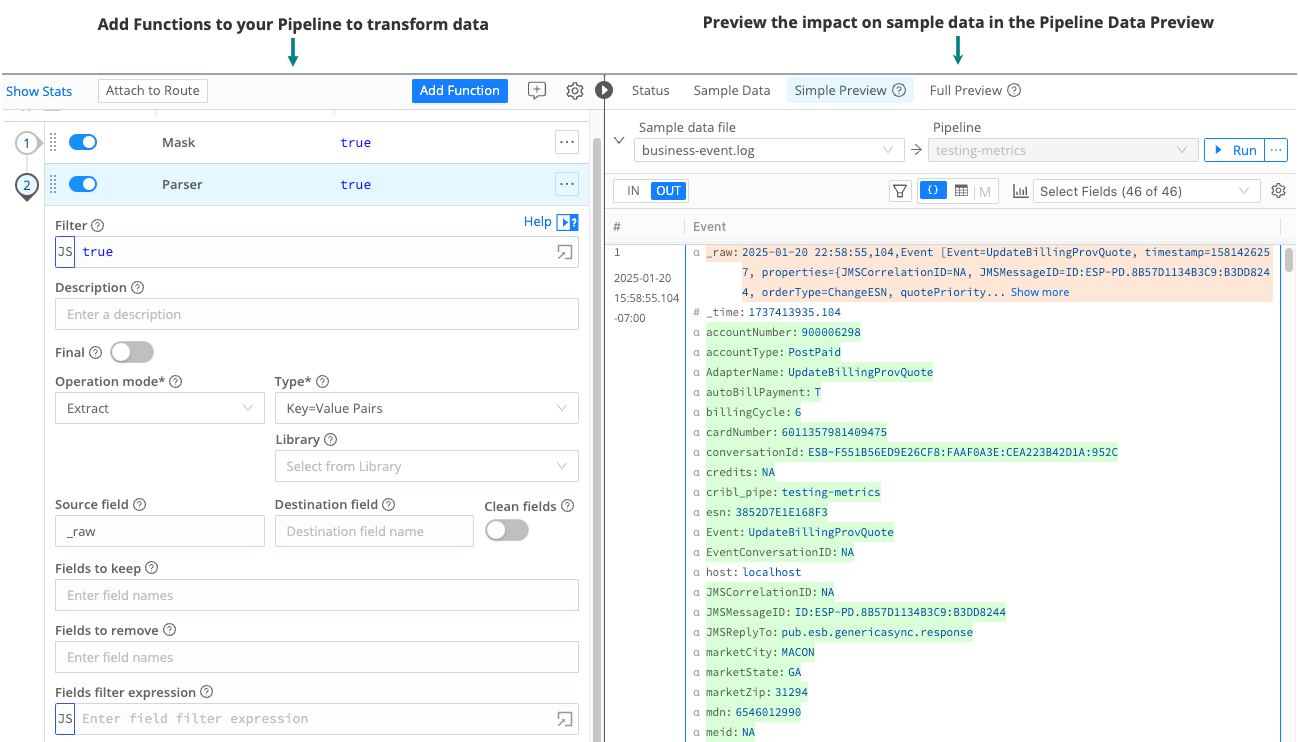
The Data Preview tool works by processing a set of sample events and passing them through the Pipeline. Then, it displays the inbound and outbound results in a dedicated pane. Whenever you modify, add, or remove a Function, the output updates instantly to reflect your changes.
For example, suppose you add a Parser Function to your Pipeline to convert raw, unstructured data into structured key-value pairs. After parsing, you may choose to promote these key-value pairs to the field level to enhance data processing and analysis. To verify these changes meet your expectations, you can use the OUT tab in the Data Preview pane to review the transformed data.
In addition to previewing data, the Data Preview offers:
- Metrics View: This metrics-first view in the Data Preview pane automatically detects and visualizes metrics in your sample data, organizing them by metric name for a more intuitive experience. Designed for metrics-heavy datasets, this view provides insights into key metrics, dimensions, and time series. It helps you identify high-cardinality data (datasets with a large number of uncommon or unique values), enabling you to make informed decisions about data processing before forwarding it to potentially costly downstream receivers. See Metrics View and Manage Metrics and High Cardinality for more information.
- Pipeline diagnostics: Includes status updates and summary throughput statistics to assess the health of the Pipeline and its Functions. See Pipeline Diagnostics and Statistics for more details.
Data preview on the Simple Preview tab is limited to 10 MB of data. This cap prevents excessive data processing and safeguards system stability. If the dataset is more than 10 MB when a simple preview runs, Cribl Edge will limit the preview to 10 MB and stop processing data beyond that limit.
The Get Started With Cribl Stream tutorial provides hands-on experience with the Pipeline Data Preview if you would like to learn more about this tool through personal experimentation and exploration.
How to Use the Data Preview Tool
To use the Data Preview tool:
Create or import some sample data. See Create and Share Data Samples for information about different methods to generate sample data.
Then, use the different Data Preview views to test and validate the changes you make in your Pipeline. See Explore Data and Validate Pipelines with Different Views to learn about the different views you can apply to your data.
Explore Data and Validate Pipelines with Different Views
Once you have created or imported sample data for your Pipeline, you can explore and analyze it using the various views available in the Data Preview pane. These views allow you to preview and test changes in real time, helping ensure that your data processing Functions produce the expected results. By leveraging the Data Preview, you can confidently validate that your Pipeline transformations align with your intended outcomes.
Simple or Full Previews
Select Simple Preview or Full Preview beside a file name to display its events in the Preview pane:
- Simple Preview: View events on either the IN or the OUT (processed) side of a single Pipeline.
- Full Preview: View events on the OUT side of either the processing or post-processing Pipeline. Selecting this option expands the Preview pane’s upper controls to include an Exit Point drop-down, where you make this choice.
Before and After Views
The Data Preview pane offers two time-based display options for previewing sample data:
- The IN tab displays samples as they appear on the way in to the Pipeline, before data processing.
- The OUT tab displays the same information, but shows the sample data as it will appear on way out of the Pipeline after the data processing. Use the Select Fields drop-down menu to control which fields the OUT tab displays.
In most cases, you will typically use the OUT tab to preview, test, and validate your Pipeline.
Event and Table Views
The Data Preview toolbar has several available views. Each format can be useful, depending on the type of data you are previewing.
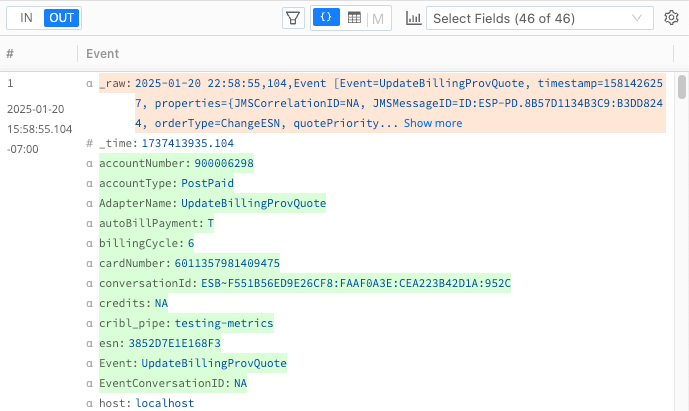
The Event View displays data in JSON format for both the IN and OUT tabs.
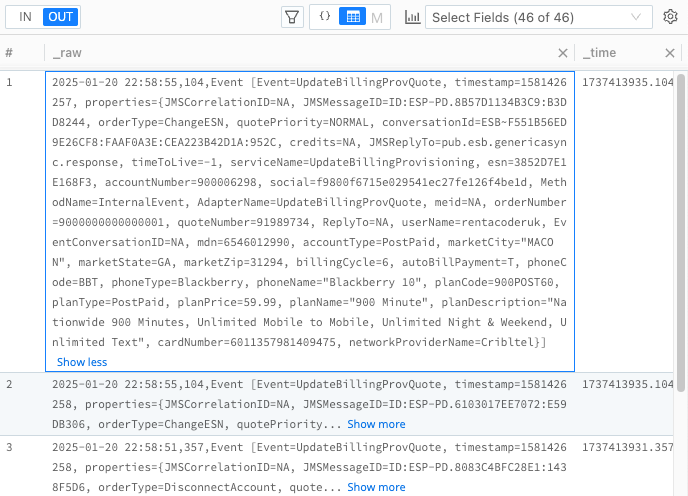
The Table View in displays data as a table for both the IN and OUT tabs.
Metrics View
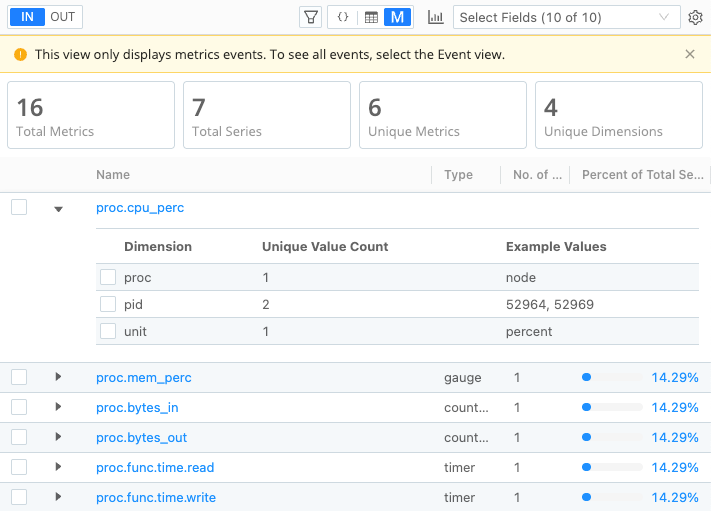
If your data sample contains metric events, the Data Preview automatically switches to the Metrics view. It intelligently detects the underlying data structure and switches to this view when needed to display relevant insights. This metrics-first view allows you to visualize metric events as you build your Pipeline. It allows you to analyze metrics, dimensions, time series, the number of unique values, and the percentage each metric contributes to the total time series. See Manage Metrics and High Cardinality for more information about using Metrics View.
Pipeline Diagnostics and Statistics
This section explains the available tools in the Data Preview that you can use to get information about your Pipeline and Functions.
Check Pipeline Status
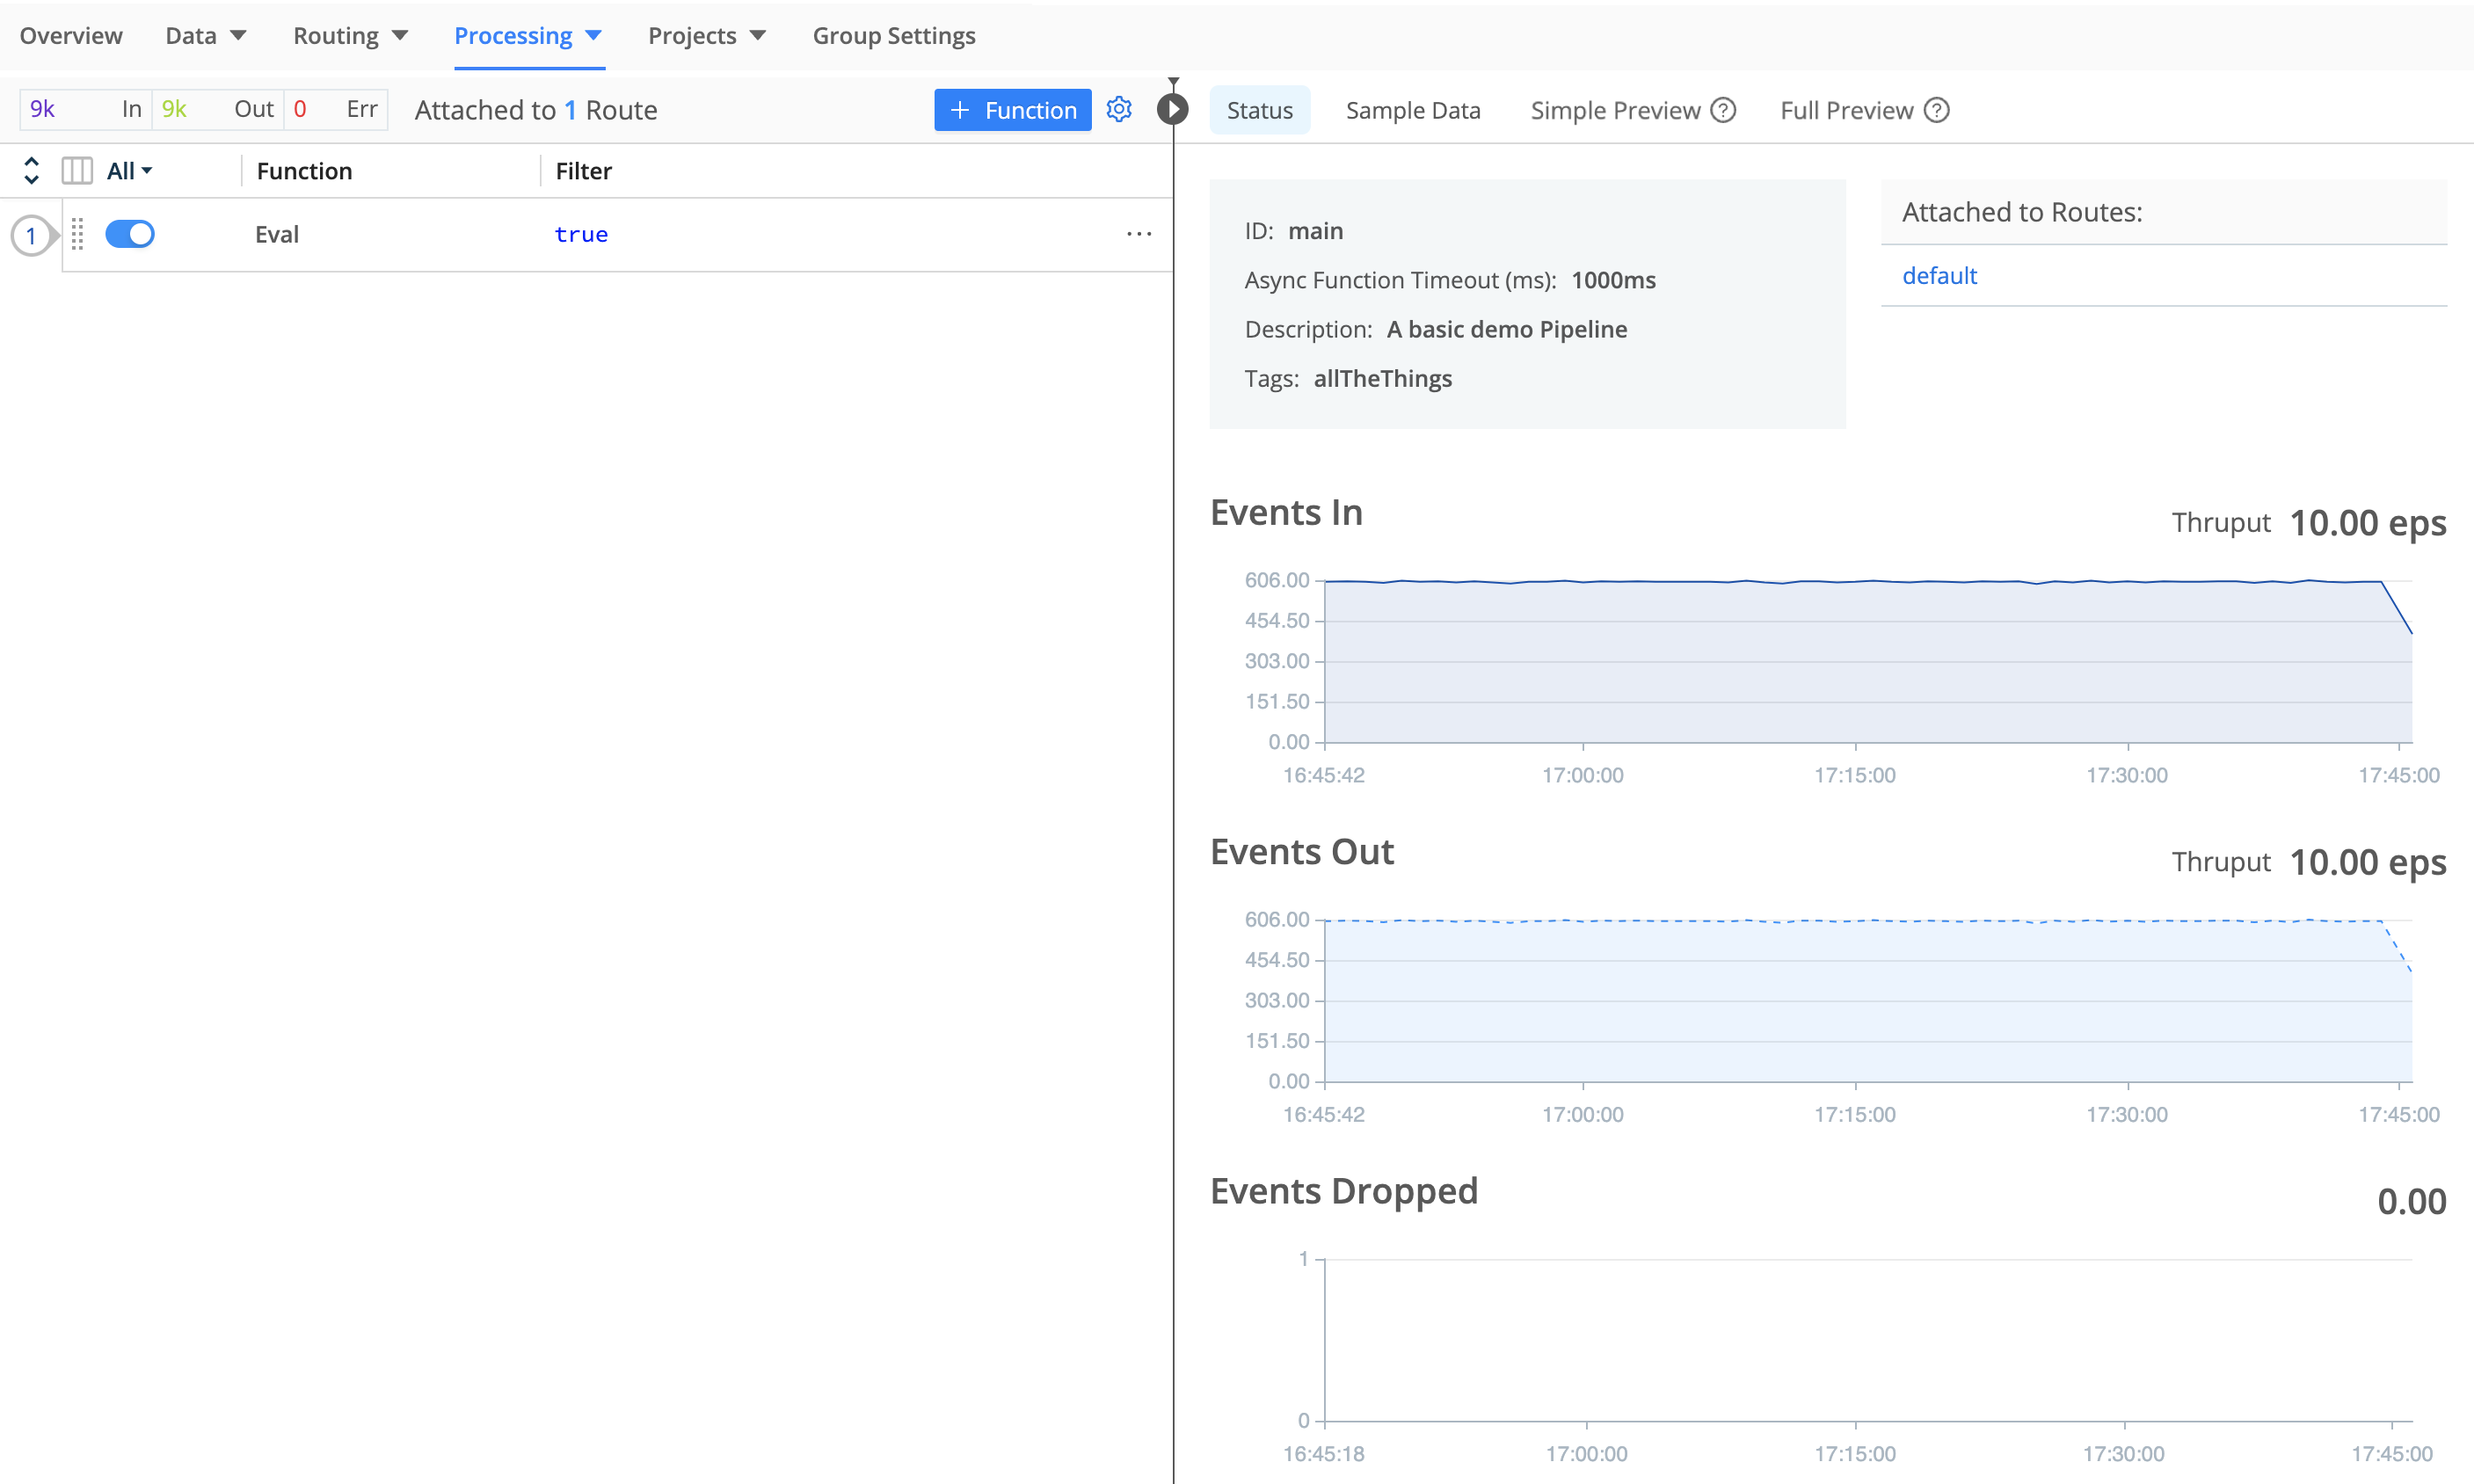
From the Pipelines page, select any Pipeline to display a Status tab in the Data Preview pane. Select this tab to show graphs of the Pipeline Events In, Events Out, and Events Dropped over time, along with summary throughput statistics (in events per second).
Pipeline Profiling
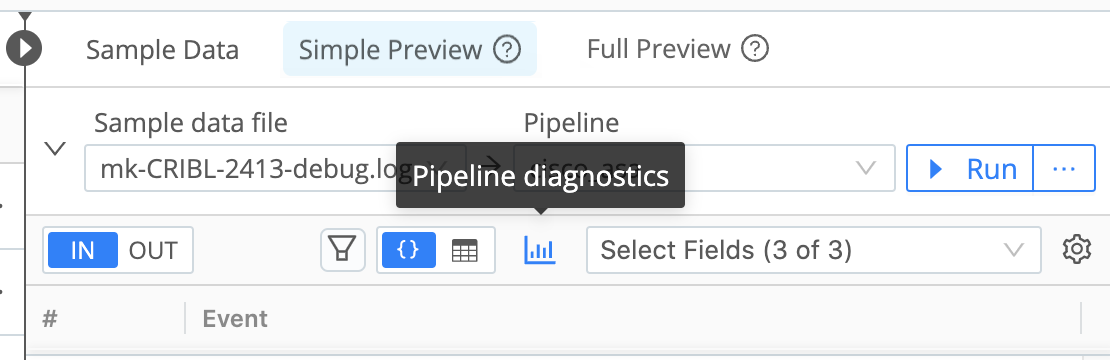
At top of the Preview pane, you can select a sample data file and Pipeline, then select the Pipeline diagnostics (bar-graph) button to access statistics on the selected Pipeline’s performance.
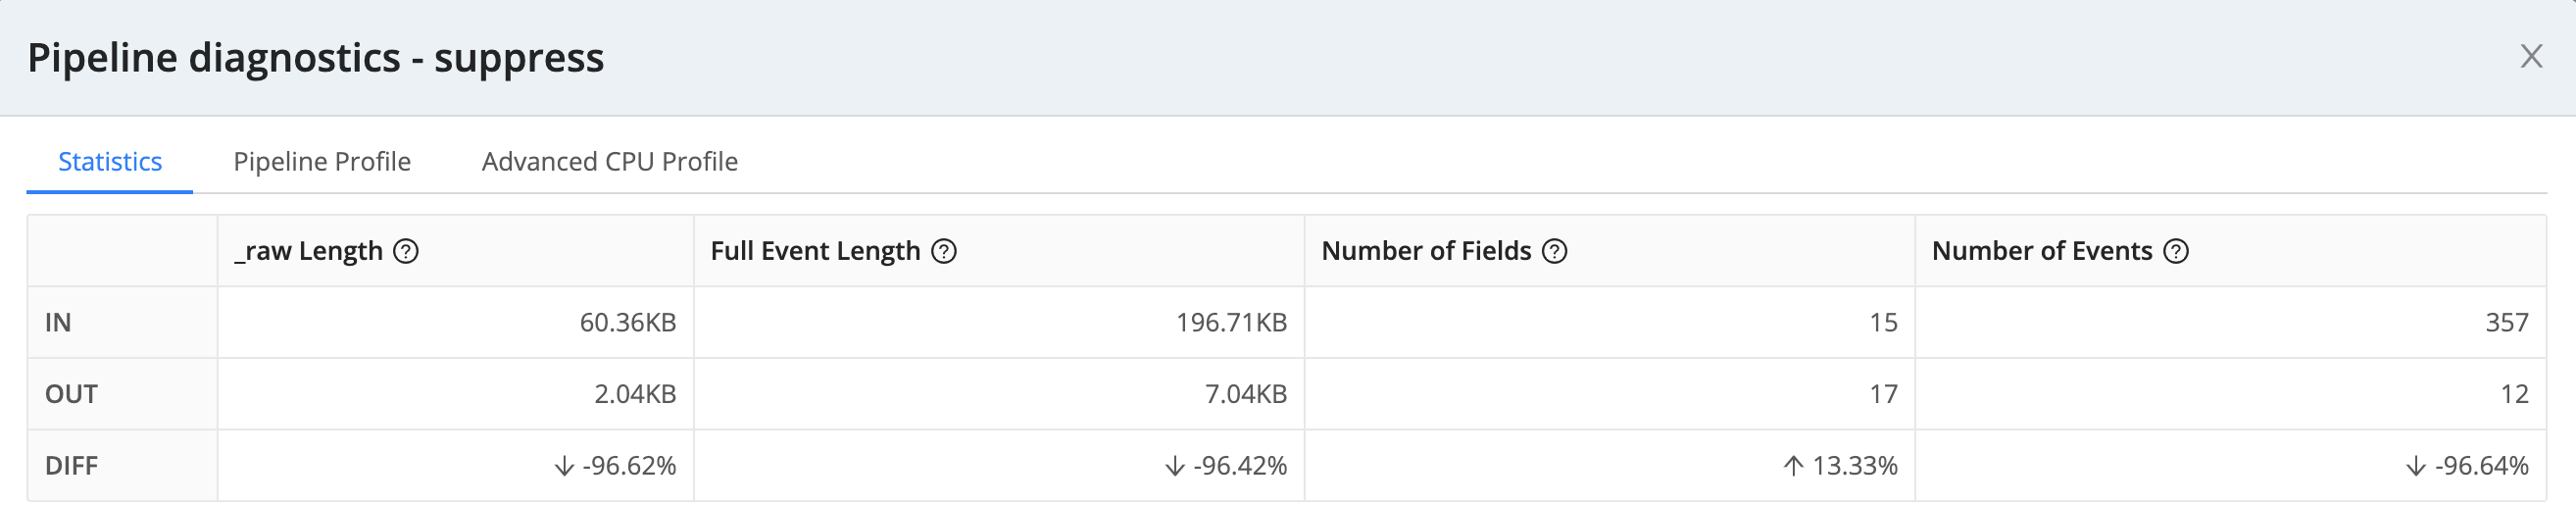
The Statistics tab in the resulting modal displays the processing impact of the Pipeline on field length and counts.
The Pipeline Profile tab, available from the Simple Preview tab, helps you debug your Pipeline by showing the contribution of individual Functions to data volume, events count, and the Pipeline processing time. Every Function has a minimum processing time, including Functions that make no changes to event data, such as the Comment Function.
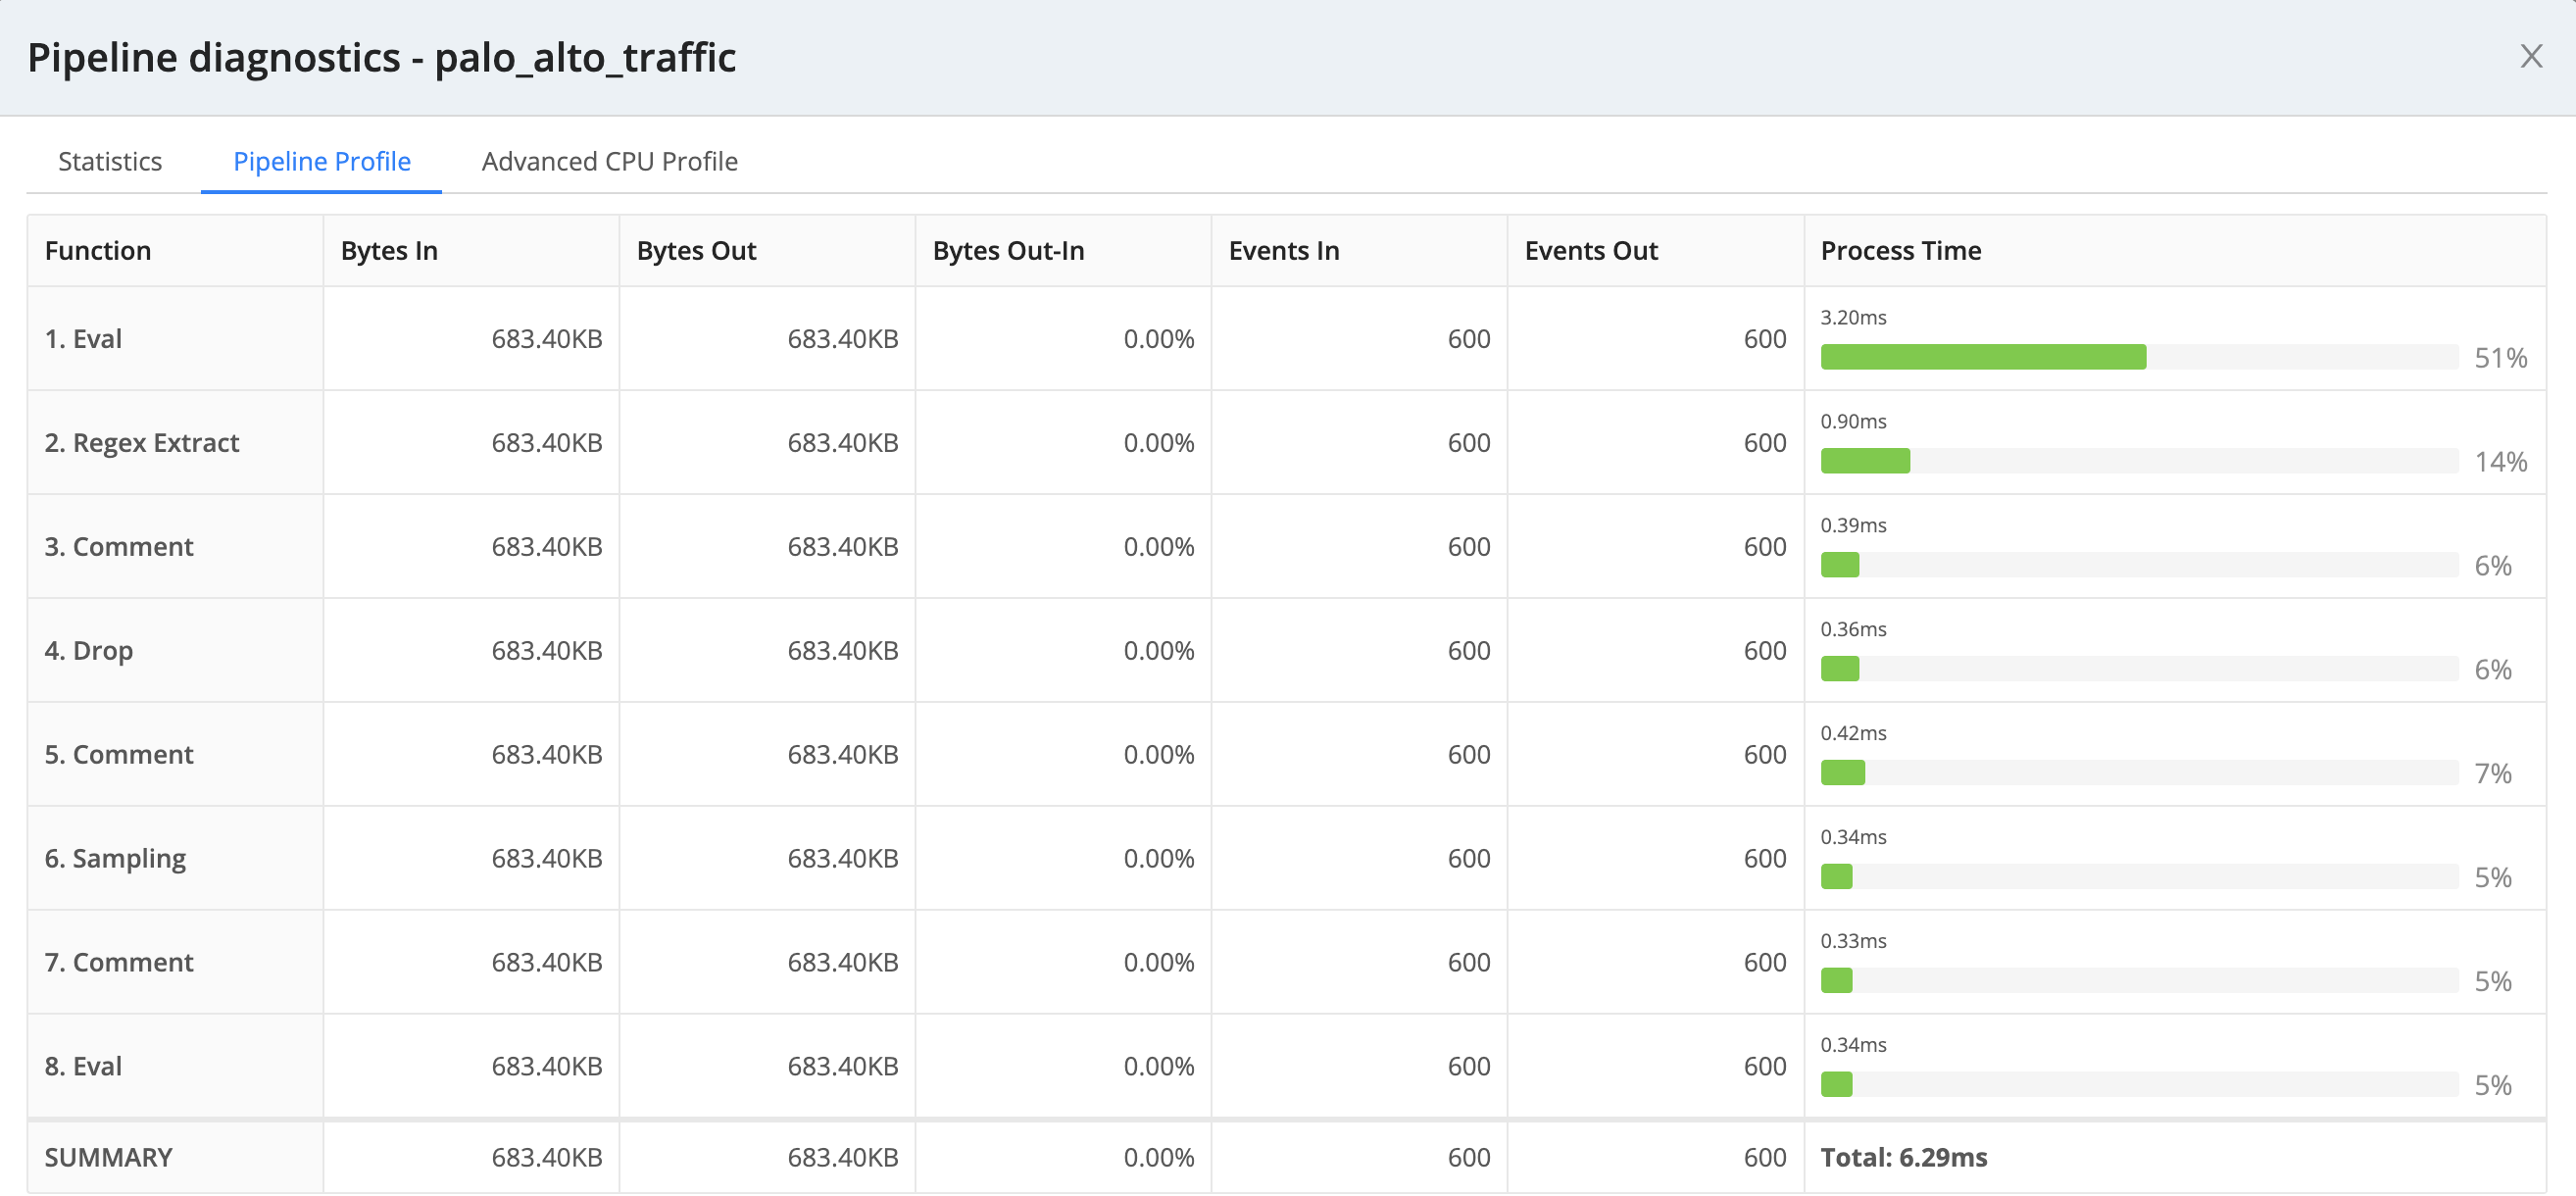
When you profile a Chain Function, this tab condenses all of the chained Pipeline’s processing into a single Chain row. To see individual statistics on the aggregated Functions, profile the chained Pipeline separately.
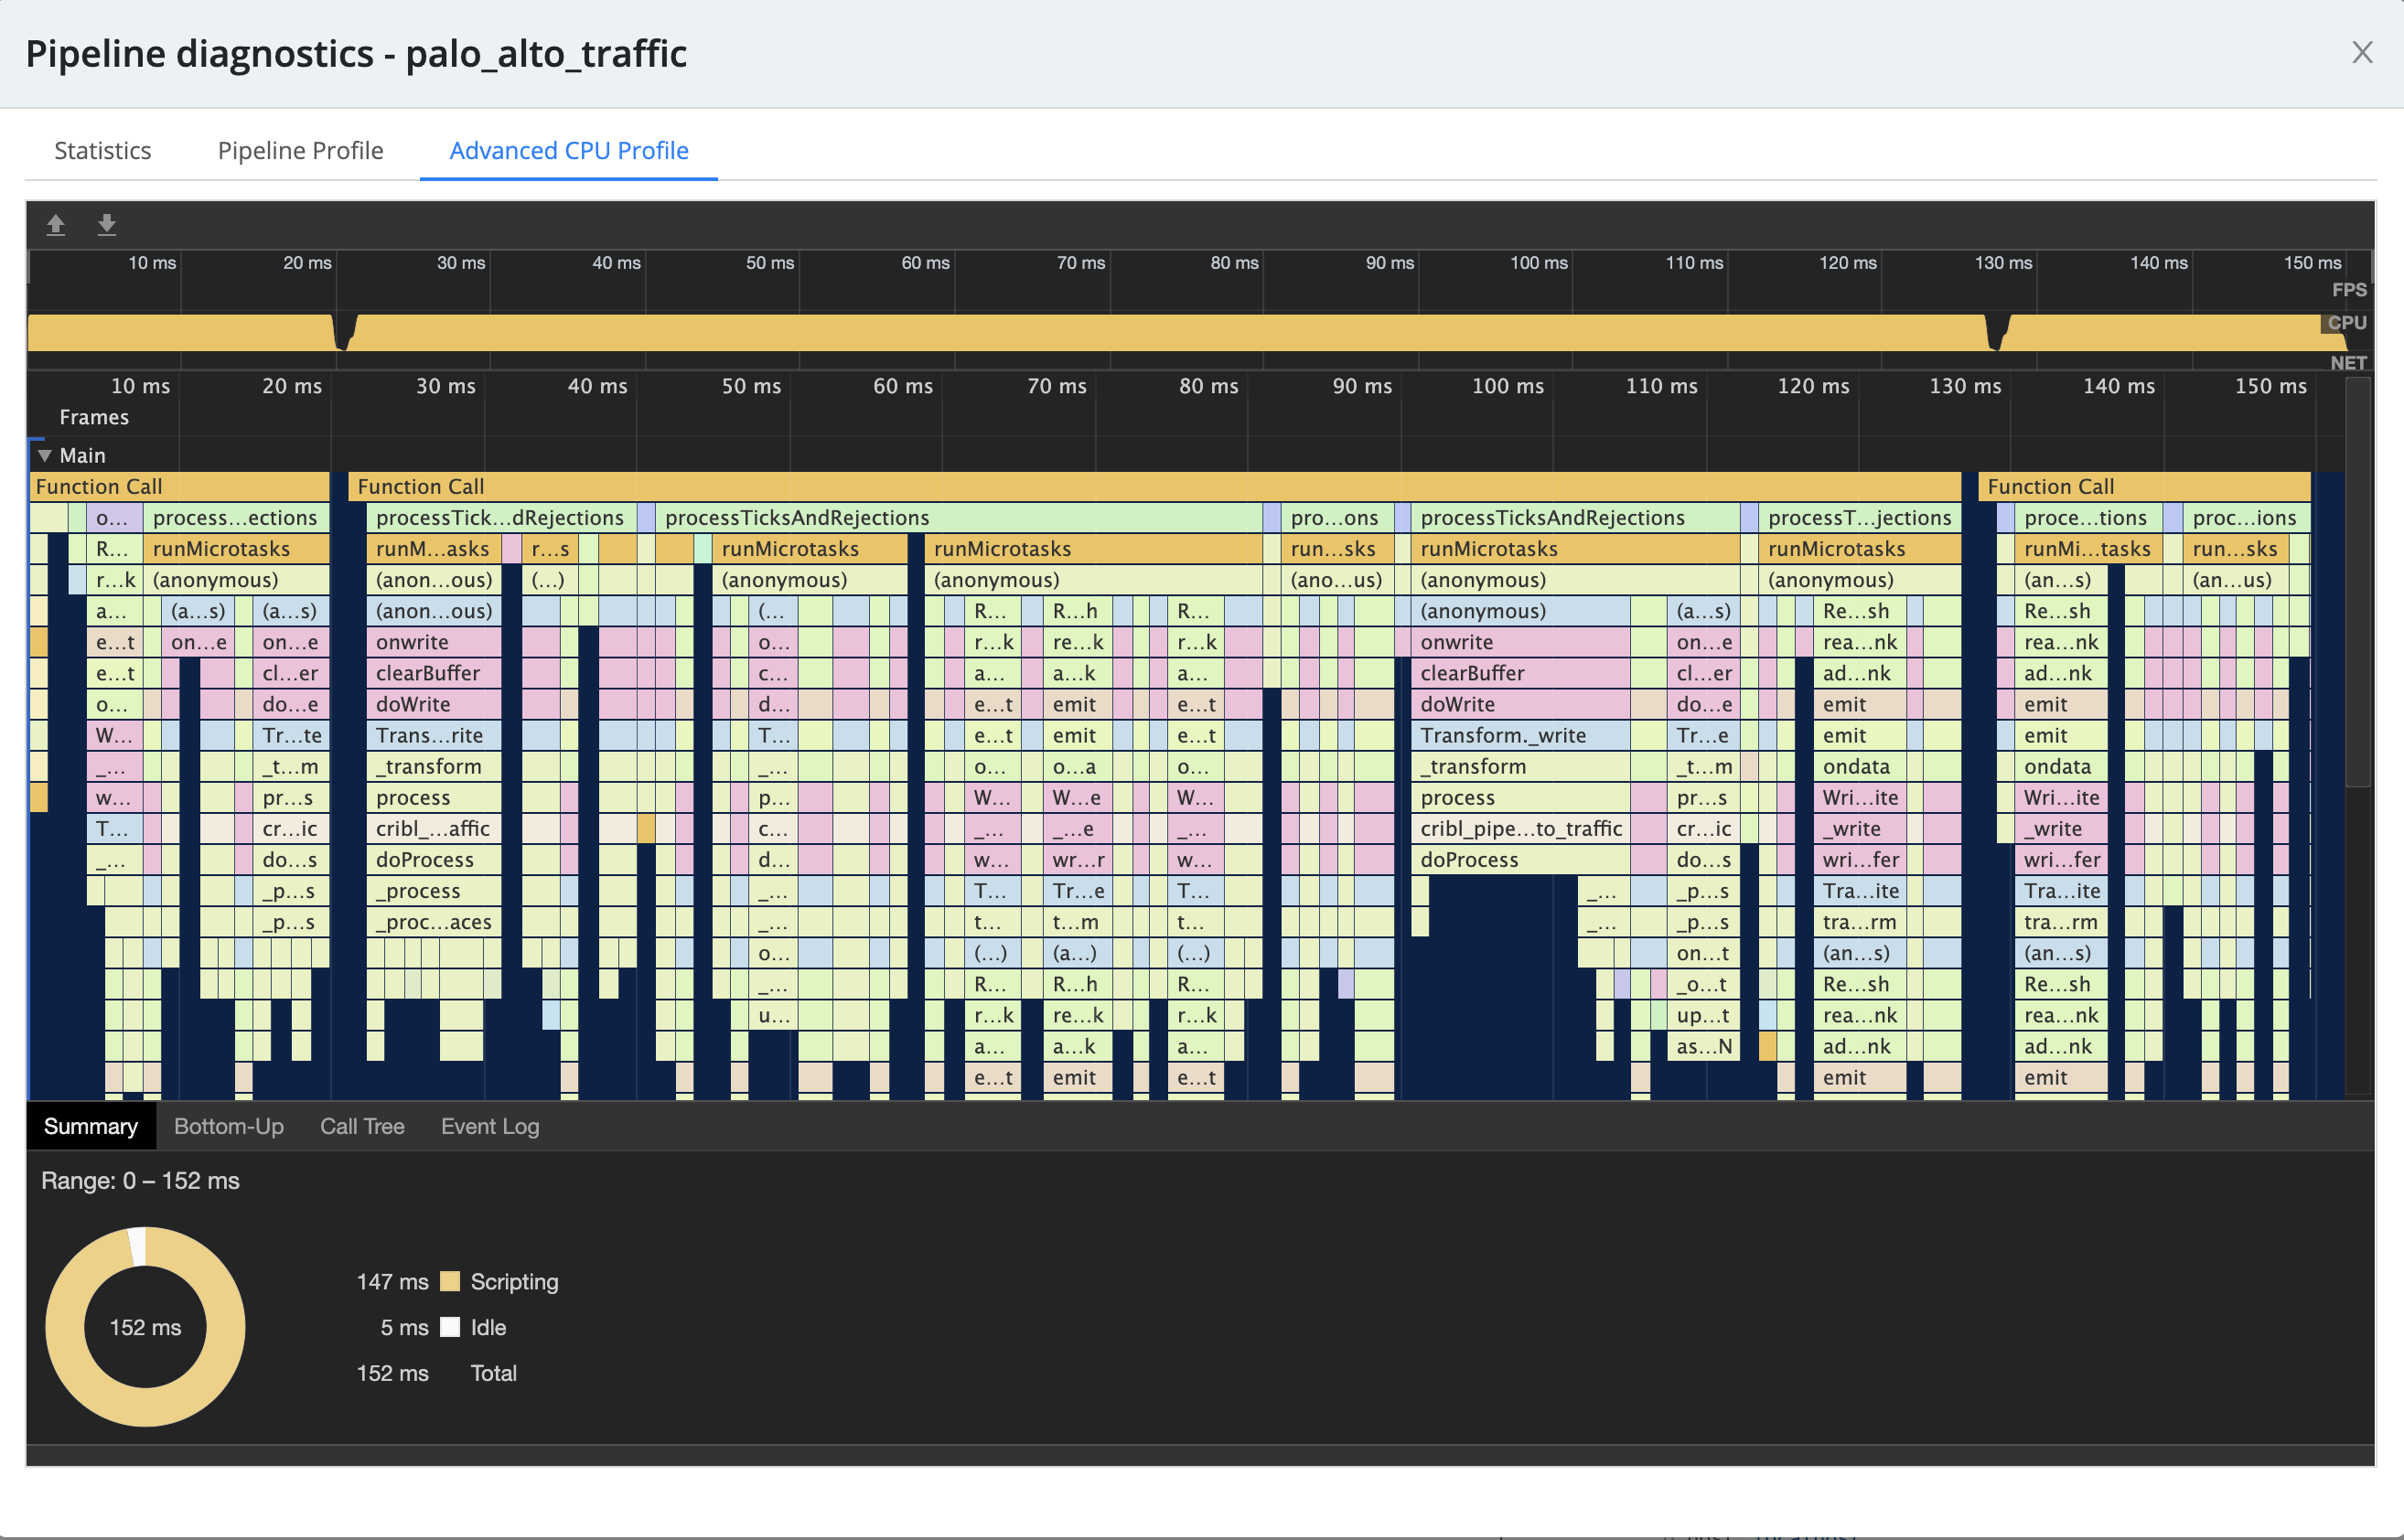
The Advanced CPU Profile tab, available from the Simple Preview tab, displays richer details on individual Function stacks.
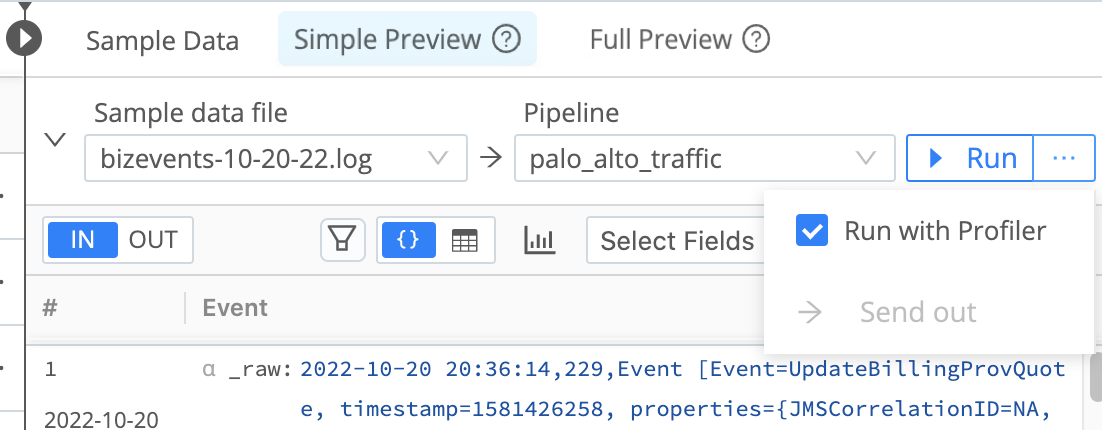
You can disable the profiling features to regain their own (minimal) resources. To disable profiling features, select the drop-down list beside the Run button and clear the Run with Profiler check box.
Advanced Settings
The Advanced Settings menu
 includes Show Dropped Events, Show Internal Fields, and Enable Diff toggles, which control how the OUT tab displays changes to event data.
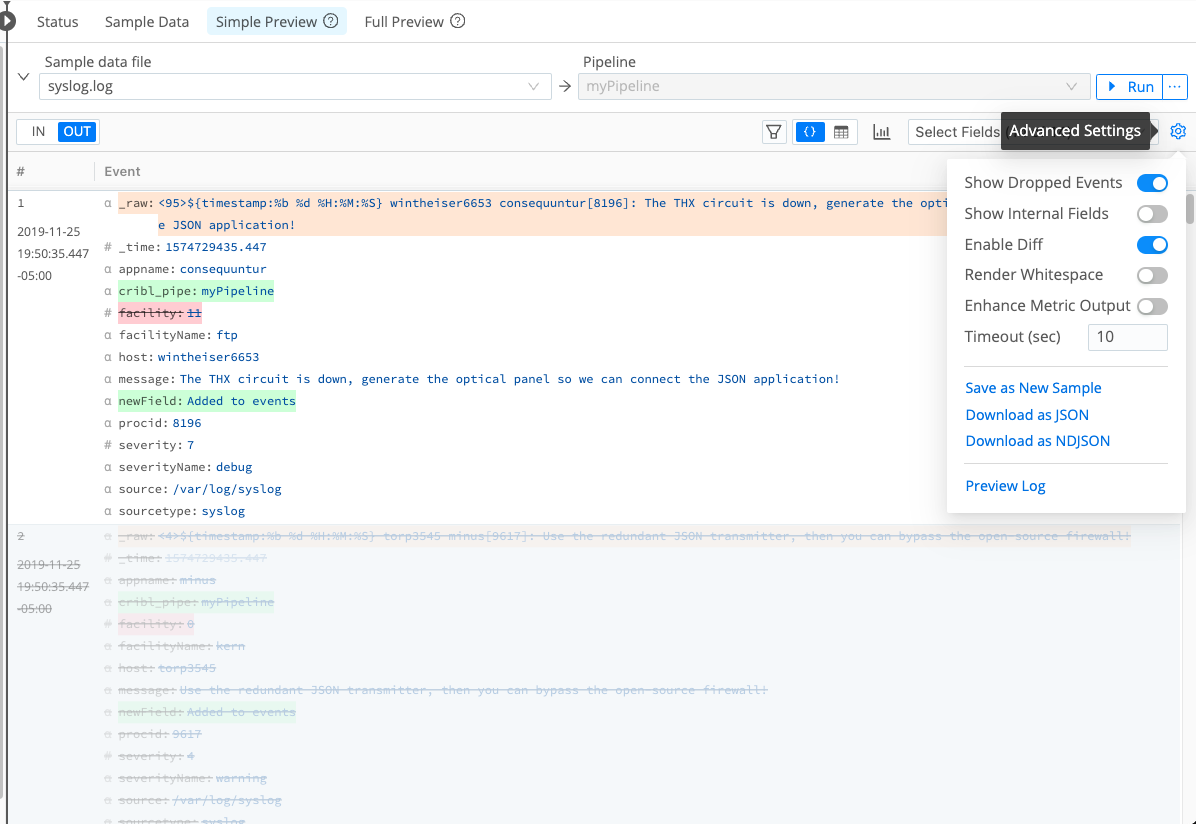
If you enable the Show Dropped Events and Enable Diff toggles, the OUT tab displays event data as follows:
- Modified fields are highlighted in amber.
- Added fields are highlighted in green.
- Deleted fields are highlighted in red and displayed in strikethrough text.
- Dropped events are displayed in strikethrough text.
The rest of this section describes the additional fields available in Advanced Settings.
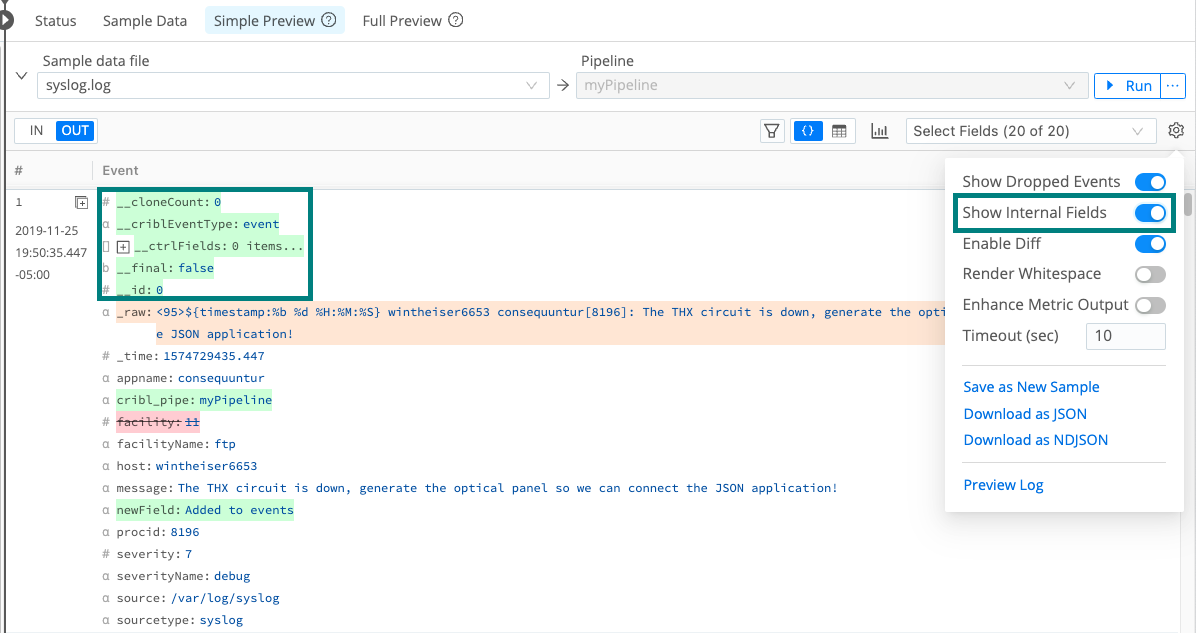
Show Internal Fields: Display fields that Cribl Edge adds to events, as well as Source-specific fields that Cribl Edge forwards from upstream senders.
Render Whitespace: This toggles between displaying carriage returns, newlines, tabs, and spaces as white space, versus as (respectively) the symbols ␍, ↵, →, and ·.
Enhance Metric Output: Controls how the OUT tab presents the Metric name expression resulting from the Publish Metrics Function. When you disable this setting (default), Cribl Edge represents the Metric name expression as literal expression string. Enable the setting to see the expression evaluated in the OUT tab.
Timeout (Sec): If large sample files time out before they fully load, you can adjust this setting to increase the default value of 10 seconds. Cribl Edge interprets a blank field as the minimum allowed timeout value of 1 second.
Save as New Sample: Enables you to save your captured data to a file, using either the Download as JSON or the Download as NDJSON (Newline-Delimited JSON) option.
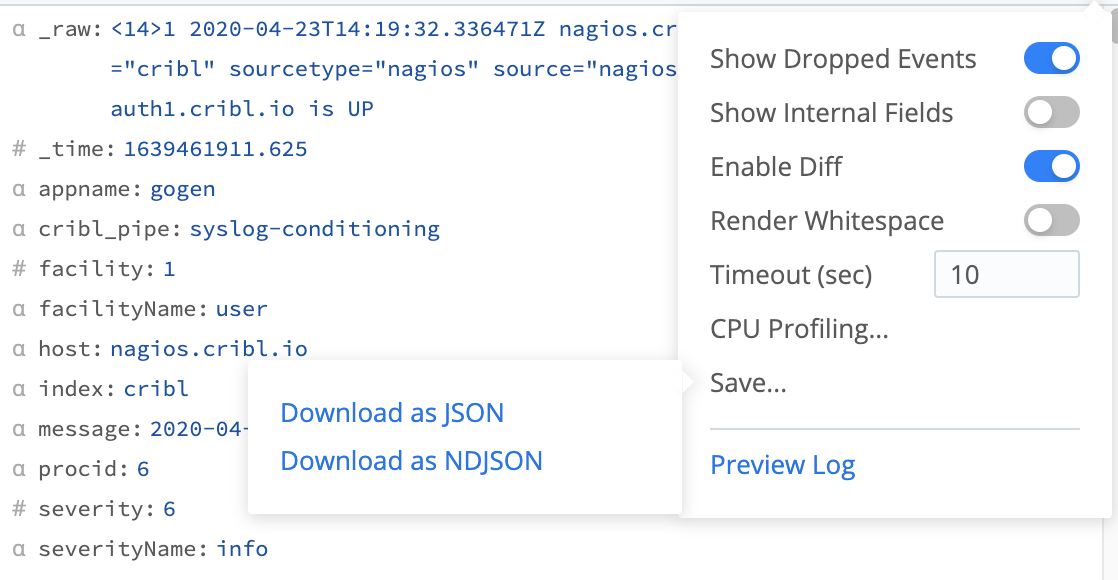
Preview Log: Opens a modal where you can preview Cribl Edge’s internal logs summarizing how this data sample was processed and captured.